Install PostgreSQL 18 with CloudNativePG on RedHat OpenShift Local
This post shows how to install a highly available PostgreSQL 18 cluster with the CloudNativePG operator (version 1.30.2) on RedHat OpenShift Local. The OpenShift Local cluster was set up in my last post Install RedHat OpenShift Local on Windows 11 and is up and running.
CloudNativePG (CNPG) is an open source Kubernetes operator (Apache 2.0 license) that covers the complete lifecycle of a PostgreSQL cluster: it creates a primary and any number of standby instances with native streaming replication and takes care of switchover, automated failover, rolling updates, backups and monitoring. In contrast to a classic HA setup like the one in my post about PostgreSQL 18 with Patroni, no additional tools like Patroni or etcd are needed: the operator keeps the state of the cluster in the Kubernetes API server.
For production use on OpenShift, EDB offers a certified and supported version of CloudNativePG through the RedHat catalog. In this post we use the community version, which is installed with a single manifest and is perfect for testing. Like OpenShift Local itself, this setup is not meant for production: all three PostgreSQL instances run on the single OpenShift node.
Prerequisites
The following is needed:
- A running OpenShift Local cluster (OpenShift preset) as described in Install RedHat OpenShift Local on Windows 11
- The
occommand in the PATH of the PowerShell session (& crc oc-env | Invoke-Expression) - At least 14 GB (better 16 GB) memory for the OpenShift VM if we want to enable monitoring (
crc config set memory 16384) - Internet access from the cluster to pull the operator and PostgreSQL images from ghcr.io
- Optional: a PostgreSQL 18 client (psql or pgAdmin) on Windows to connect from outside the cluster
First we check that the cluster is running, log in as cluster administrator and check the default storage class, which is used for the persistent volumes of the database:
# the cluster must be running
crc status
# log in as cluster administrator (password: crc console --credentials)
oc login -u kubeadmin https://api.crc.testing:6443
# OpenShift Local provides a default storage class for persistent volumes
oc get storageclass
Sample Output (click to expand):
PS C:\Users\User1> # the cluster must be running
PS C:\Users\User1> crc status
CRC VM:          Running
OpenShift:       Running (v5.0.0)
RAM Usage:       7.838GB of 16.76GB
Disk Usage:      25.33GB of 63.82GB (Inside the CRC VM)
Cache Usage:     28.26GB
Cache Directory: C:\Users\User1\.crc\cache
PS C:\Users\User1> # log in as cluster administrator (password: crc console --credentials)
PS C:\Users\User1> oc login -u kubeadmin https://api.crc.testing:6443
Logged into "https://api.crc.testing:6443" as "kubeadmin" using existing credentials.

You have access to 65 projects, the list has been suppressed. You can list all projects with 'oc projects'

Using project "default".
PS C:\Users\User1> # OpenShift Local provides a default storage class for persistent volumes
PS C:\Users\User1> oc get storageclass
NAME                                     PROVISIONER                        RECLAIMPOLICY   VOLUMEBINDINGMODE      ALLOWVOLUMEEXPANSION   AGE
crc-csi-hostpath-provisioner (default)   kubevirt.io.hostpath-provisioner   Retain          WaitForFirstConsumer   false                  17d
PS C:\Users\User1>
Installing the CloudNativePG Operator
The operator is installed with the release manifest of version 1.30.2. It creates the namespace cnpg-system, the custom resource definitions (CRDs) like Cluster, Backup or Pooler, the RBAC objects, the webhooks and the operator deployment. The option --server-side is required, because some of the CRDs are too large for a client-side apply.
# install the operator
oc apply --server-side -f https://raw.githubusercontent.com/cloudnative-pg/cloudnative-pg/release-1.30/releases/cnpg-1.30.2.yaml
# OpenShift: allow the operator service account to run with its fixed UID 10001
oc adm policy add-scc-to-user nonroot-v2 -z cnpg-manager -n cnpg-system
# create the operator pod again (the first attempt was rejected by the default SCC)
oc rollout restart deployment -n cnpg-system cnpg-controller-manager
# wait until the operator deployment is ready
oc rollout status deployment -n cnpg-system cnpg-controller-manager
# the operator pod
oc get pods -n cnpg-system
# the new custom resource definitions
oc get crd -o name | Select-String cnpg
Sample Output (click to expand):
PS C:\Users\User1> # install the operator
PS C:\Users\User1> oc apply --server-side -f https://raw.githubusercontent.com/cloudnative-pg/cloudnative-pg/release-1.30/releases/cnpg-1.30.2.yaml
namespace/cnpg-system serverside-applied
customresourcedefinition.apiextensions.k8s.io/backups.postgresql.cnpg.io serverside-applied
customresourcedefinition.apiextensions.k8s.io/clusterimagecatalogs.postgresql.cnpg.io serverside-applied
customresourcedefinition.apiextensions.k8s.io/clusters.postgresql.cnpg.io serverside-applied
customresourcedefinition.apiextensions.k8s.io/databaseroles.postgresql.cnpg.io serverside-applied
customresourcedefinition.apiextensions.k8s.io/databases.postgresql.cnpg.io serverside-applied
customresourcedefinition.apiextensions.k8s.io/failoverquorums.postgresql.cnpg.io serverside-applied
customresourcedefinition.apiextensions.k8s.io/imagecatalogs.postgresql.cnpg.io serverside-applied
customresourcedefinition.apiextensions.k8s.io/poolers.postgresql.cnpg.io serverside-applied
customresourcedefinition.apiextensions.k8s.io/publications.postgresql.cnpg.io serverside-applied
customresourcedefinition.apiextensions.k8s.io/scheduledbackups.postgresql.cnpg.io serverside-applied
customresourcedefinition.apiextensions.k8s.io/subscriptions.postgresql.cnpg.io serverside-applied
serviceaccount/cnpg-manager serverside-applied
clusterrole.rbac.authorization.k8s.io/cnpg-database-editor-role serverside-applied
clusterrole.rbac.authorization.k8s.io/cnpg-database-viewer-role serverside-applied
clusterrole.rbac.authorization.k8s.io/cnpg-manager serverside-applied
clusterrole.rbac.authorization.k8s.io/cnpg-publication-editor-role serverside-applied
clusterrole.rbac.authorization.k8s.io/cnpg-publication-viewer-role serverside-applied
clusterrole.rbac.authorization.k8s.io/cnpg-subscription-editor-role serverside-applied
clusterrole.rbac.authorization.k8s.io/cnpg-subscription-viewer-role serverside-applied
clusterrolebinding.rbac.authorization.k8s.io/cnpg-manager-rolebinding serverside-applied
configmap/cnpg-default-monitoring serverside-applied
service/cnpg-webhook-service serverside-applied
deployment.apps/cnpg-controller-manager serverside-applied
mutatingwebhookconfiguration.admissionregistration.k8s.io/cnpg-mutating-webhook-configuration serverside-applied
validatingwebhookconfiguration.admissionregistration.k8s.io/cnpg-validating-webhook-configuration serverside-applied
PS C:\Users\User1> # OpenShift: allow the operator service account to run with its fixed UID 10001
PS C:\Users\User1> oc adm policy add-scc-to-user nonroot-v2 -z cnpg-manager -n cnpg-system
clusterrole.rbac.authorization.k8s.io/system:openshift:scc:nonroot-v2 added: "cnpg-manager"
PS C:\Users\User1> # create the operator pod again (the first attempt was rejected by the default SCC)
PS C:\Users\User1> oc rollout restart deployment -n cnpg-system cnpg-controller-manager
deployment.apps/cnpg-controller-manager restarted
PS C:\Users\User1> # wait until the operator deployment is ready
PS C:\Users\User1> oc rollout status deployment -n cnpg-system cnpg-controller-manager
Waiting for deployment "cnpg-controller-manager" rollout to finish: 1 old replicas are pending termination...
Waiting for deployment "cnpg-controller-manager" rollout to finish: 1 old replicas are pending termination...
Waiting for deployment "cnpg-controller-manager" rollout to finish: 1 old replicas are pending termination...
deployment "cnpg-controller-manager" successfully rolled out
PS C:\Users\User1> # the operator pod
PS C:\Users\User1> oc get pods -n cnpg-system
NAME                                       READY   STATUS        RESTARTS   AGE
cnpg-controller-manager-5cd6d786c8-mmwn8   1/1     Running       0          12s
cnpg-controller-manager-864ff694-4k56w     1/1     Terminating   0          12s
PS C:\Users\User1> # the new custom resource definitions
PS C:\Users\User1> oc get crd -o name | Select-String cnpg

customresourcedefinition.apiextensions.k8s.io/backups.postgresql.cnpg.io
customresourcedefinition.apiextensions.k8s.io/clusterimagecatalogs.postgresql.cnpg.io
customresourcedefinition.apiextensions.k8s.io/clusters.postgresql.cnpg.io
customresourcedefinition.apiextensions.k8s.io/databaseroles.postgresql.cnpg.io
customresourcedefinition.apiextensions.k8s.io/databases.postgresql.cnpg.io
customresourcedefinition.apiextensions.k8s.io/failoverquorums.postgresql.cnpg.io
customresourcedefinition.apiextensions.k8s.io/imagecatalogs.postgresql.cnpg.io
customresourcedefinition.apiextensions.k8s.io/poolers.postgresql.cnpg.io
customresourcedefinition.apiextensions.k8s.io/publications.postgresql.cnpg.io
customresourcedefinition.apiextensions.k8s.io/scheduledbackups.postgresql.cnpg.io
customresourcedefinition.apiextensions.k8s.io/subscriptions.postgresql.cnpg.io


PS C:\Users\User1>
By default the operator watches all namespaces. Only the operator pod itself needs the additional nonroot-v2 SCC (granted above), because the release manifest runs it with the fixed UID 10001. It detects that it is running on OpenShift and does not set a fixed user ID for the PostgreSQL pods. So the database pods run with the default restricted-v2 security context constraint (SCC), and no further privileges (like the anyuid SCC) are needed.
Creating a PostgreSQL Cluster
For the database we create a new project (namespace) pgdemo:
oc new-project pgdemoA PostgreSQL cluster is described by a Cluster resource. We create the file C:\sw\openshift\pg-cluster.yaml for a cluster with three instances (one primary and two standbys), 2 GB of storage per instance and a database app owned by the user app:
New-Item -ItemType Directory -Path C:\sw\openshift -Force | Out-Null
cd C:\sw\openshift
@'
apiVersion: postgresql.cnpg.io/v1
kind: Cluster
metadata:
  name: pg-cluster
spec:
  # one primary and two standby instances
  instances: 3
  # no imageName: the operator uses its default image (PostgreSQL 18.7 for CNPG 1.30.2)
  storage:
    size: 2Gi
  postgresql:
    parameters:
      shared_buffers: "256MB"
      max_connections: "100"
  bootstrap:
    initdb:
      database: app
      owner: app
  resources:
    requests:
      memory: "512Mi"
      cpu: "250m"
    limits:
      memory: "1Gi"
'@ | Set-Content -Path .\pg-cluster.yaml
Now we create the cluster and watch the operator at work:
oc apply -f .\pg-cluster.yaml
# wait until the PostgreSQL cluster is ready (all instances running)
oc wait --for=condition=Ready cluster/pg-cluster --timeout=600s
# the PostgreSQL pods
oc get pods -l cnpg.io/cluster=pg-cluster
# status of the PostgreSQL cluster
oc get cluster pg-cluster
Sample Output (click to expand):
PS C:\sw\openshift> oc apply -f .\pg-cluster.yaml
cluster.postgresql.cnpg.io/pg-cluster created
PS C:\sw\openshift> # wait until the PostgreSQL cluster is ready (all instances running)
PS C:\sw\openshift> oc wait --for=condition=Ready cluster/pg-cluster --timeout=600s
cluster.postgresql.cnpg.io/pg-cluster condition met
PS C:\sw\openshift> # the PostgreSQL pods
PS C:\sw\openshift> oc get pods -l cnpg.io/cluster=pg-cluster
NAME           READY   STATUS    RESTARTS   AGE
pg-cluster-1   1/1     Running   0          51s
pg-cluster-2   1/1     Running   0          29s
pg-cluster-3   1/1     Running   0          11s
PS C:\sw\openshift> # status of the PostgreSQL cluster
PS C:\sw\openshift> oc get cluster pg-cluster
NAME         AGE   INSTANCES   READY   STATUS                     PRIMARY
pg-cluster   98s   3           3       Cluster in healthy state   pg-cluster-1
PS C:\sw\openshift>
The operator first runs a job (pg-cluster-1-initdb), which initializes the database on the volume of the first instance, and starts the primary pg-cluster-1. Then the standbys pg-cluster-2 and pg-cluster-3 are created by cloning the primary with pg_basebackup (jobs pg-cluster-2-join and pg-cluster-3-join). After a few minutes the cluster reports the status Cluster in healthy state.
Let’s take a look at the objects the operator has created:
# one persistent volume claim (PVC) per instance
oc get pvc
# services: -rw = primary (read/write), -ro = standbys only (read-only), -r = any instance (read)
oc get svc
# secret with user name, password and connection strings of the application user app
oc get secret pg-cluster-app
Sample Output (click to expand):
PS C:\sw\openshift> # one persistent volume claim (PVC) per instance
PS C:\sw\openshift> oc get pvc
NAME           STATUS   VOLUME                                     CAPACITY   ACCESS MODES   STORAGECLASS                   VOLUMEATTRIBUTESCLASS   AGE
pg-cluster-1   Bound    pvc-14eda3b3-9930-48a9-a11d-600fe2a99584   59Gi       RWO            crc-csi-hostpath-provisioner   <unset>                 3m19s
pg-cluster-2   Bound    pvc-f70ccaf1-2212-4c7d-ad2b-6572680b3746   59Gi       RWO            crc-csi-hostpath-provisioner   <unset>                 2m27s
pg-cluster-3   Bound    pvc-a4d5287a-8dae-44a0-8d1b-7bbdbd17eaca   59Gi       RWO            crc-csi-hostpath-provisioner   <unset>                 2m6s
PS C:\sw\openshift> # services: -rw = primary (read/write), -ro = standbys only (read-only), -r = any instance (read)
PS C:\sw\openshift> oc get svc
NAME            TYPE        CLUSTER-IP     EXTERNAL-IP   PORT(S)    AGE
pg-cluster-r    ClusterIP   10.217.4.205   <none>        5432/TCP   3m20s
pg-cluster-ro   ClusterIP   10.217.5.105   <none>        5432/TCP   3m20s
pg-cluster-rw   ClusterIP   10.217.4.43    <none>        5432/TCP   3m20s
PS C:\sw\openshift> # secret with user name, password and connection strings of the application user app
PS C:\sw\openshift> oc get secret pg-cluster-app
NAME             TYPE                       DATA   AGE
pg-cluster-app   kubernetes.io/basic-auth   11     3m21s
PS C:\sw\openshift>
CloudNativePG does not use StatefulSets, it manages the pods and PVCs itself. The default pod anti-affinity is only “preferred”, which allows all three instances to run on the single node of OpenShift Local. In a cluster with several worker nodes the instances are spread across the nodes (spec.affinity.podAntiAffinityType: required enforces this).
Installing the cnpg Plugin
CloudNativePG provides a plugin for kubectl (and oc), which makes the daily work much easier: cluster status, switchover, psql sessions, logs, backups and more. The plugin is a single executable, which we download from the GitHub release page. The oc client automatically finds plugins named kubectl-* in the PATH.
cd C:\sw\openshift
# download the plugin for Windows (x86_64)
curl.exe -LO https://github.com/cloudnative-pg/cloudnative-pg/releases/download/v1.30.2/kubectl-cnpg_1.30.2_windows_x86_64.tar.gz
# extract the archive (tar.exe is part of Windows 11)
tar -xzf .\kubectl-cnpg_1.30.2_windows_x86_64.tar.gz
# copy the plugin into a directory in the PATH
New-Item -ItemType Directory -Path $HOME\bin -Force | Out-Null
Copy-Item .\kubectl-cnpg.exe $HOME\bin\
# some plugin commands (e.g. psql) call kubectl; the oc binary also works as kubectl
Copy-Item (Get-Command oc).Source $HOME\bin\kubectl.exe
# add the directory to the PATH (current session and PowerShell profile)
$env:Path += ";$HOME\bin"
Add-Content -Path $PROFILE -Value '$env:Path += ";$HOME\bin"'
# oc lists the plugins found in the PATH
oc plugin list
oc cnpg version
Sample Output (click to expand):
PS C:\sw\openshift> cd C:\sw\openshift
PS C:\sw\openshift> # download the plugin for Windows (x86_64)
PS C:\sw\openshift> curl.exe -LO https://github.com/cloudnative-pg/cloudnative-pg/releases/download/v1.30.2/kubectl-cnpg_1.30.2_windows_x86_64.tar.gz
  % Total    % Received % Xferd  Average Speed  Time    Time    Time   Current
                                 Dload  Upload  Total   Spent   Left   Speed
  0      0   0      0   0      0      0      0                              0
100 23.46M 100 23.46M   0      0  7.72M      0   00:03   00:03         10.38M
PS C:\sw\openshift> # extract the archive (tar.exe is part of Windows 11)
PS C:\sw\openshift> tar -xzf .\kubectl-cnpg_1.30.2_windows_x86_64.tar.gz
PS C:\sw\openshift> # copy the plugin into a directory in the PATH
PS C:\sw\openshift> New-Item -ItemType Directory -Path $HOME\bin -Force | Out-Null
PS C:\sw\openshift> Copy-Item .\kubectl-cnpg.exe $HOME\bin\
PS C:\sw\openshift> # some plugin commands (e.g. psql) call kubectl; the oc binary also works as kubectl
PS C:\sw\openshift> Copy-Item (Get-Command oc).Source $HOME\bin\kubectl.exe
PS C:\sw\openshift> # add the directory to the PATH (current session and PowerShell profile)
PS C:\sw\openshift> $env:Path += ";$HOME\bin"
PS C:\sw\openshift> Add-Content -Path $PROFILE -Value '$env:Path += ";$HOME\bin"'
PS C:\sw\openshift> # oc lists the plugins found in the PATH
PS C:\sw\openshift> oc plugin list
Unable to read directory "C:\\app\\oracle\\client23ai\\bin" from your PATH: open C:\app\oracle\client23ai\bin: The system cannot find the path specified.. Skipping...
Unable to read directory "C:\\ProgramData\\miniconda3\\condabin" from your PATH: open C:\ProgramData\miniconda3\condabin: The system cannot find the path specified.. Skipping...
Unable to read directory "C:\\src\\openexr\\build\\bin\\Release" from your PATH: open C:\src\openexr\build\bin\Release: The system cannot find the path specified.. Skipping...
Unable to read directory "C:\\Program Files\\KTX-Software\\bin" from your PATH: open C:\Program Files\KTX-Software\bin: The system cannot find the path specified.. Skipping...
Unable to read directory "C:\\sw\\Argyll_V3.1.0\\bin" from your PATH: open C:\sw\Argyll_V3.1.0\bin: The system cannot find the path specified.. Skipping...
Unable to read directory "C:\\sw\\apitrace\\bin" from your PATH: open C:\sw\apitrace\bin: The system cannot find the path specified.. Skipping...
Unable to read directory "C:\\sw\\gmic" from your PATH: open C:\sw\gmic: The system cannot find the file specified.. Skipping...
Unable to read directory "C:\\Users\\User1\\AppData\\Roaming\\Python\\Python312\\Scripts" from your PATH: open C:\Users\User1\AppData\Roaming\Python\Python312\Scripts: The system cannot find the file specified.. Skipping...
Unable to read directory "C:\\Users\\User1\\AppData\\Local\\Programs\\Ollama" from your PATH: open C:\Users\User1\AppData\Local\Programs\Ollama: The system cannot find the file specified.. Skipping...
The following compatible plugins are available:

C:\Users\User1\bin\kubectl-cnpg.exe
PS C:\sw\openshift> oc cnpg version
Build: {Version:1.30.2 Commit:30cca36d3 Date:2026-11-17}
PS C:\sw\openshift>
Now we can check the state of our PostgreSQL cluster:
oc cnpg status pg-cluster
Sample Output (click to expand):
PS C:\sw\openshift> oc cnpg status pg-cluster
Cluster Summary
Name                     pgdemo/pg-cluster
System ID:               7709873658365100050
PostgreSQL Image:        ghcr.io/cloudnative-pg/postgresql:18.7-system-trixie
Primary instance:        pg-cluster-1
Primary promotion time:  2026-11-19 13:27:35 +0000 UTC (35m19s)
Status:                  Cluster in healthy state
Instances:               3
Ready instances:         3
Size:                    144M
Current Write LSN:       0/8000000 (Timeline: 1 - WAL File: 000000010000000000000008)

Continuous Backup not configured

Streaming Replication status
Replication Slots Enabled
Name          Sent LSN   Write LSN  Flush LSN  Replay LSN  Write Lag  Flush Lag  Replay Lag  State      Sync State  Sync Priority  Replication Slot
----          --------   ---------  ---------  ----------  ---------  ---------  ----------  -----      ----------  -------------  ----------------
pg-cluster-2  0/8000000  0/8000000  0/8000000  0/8000000   00:00:00   00:00:00   00:00:00    streaming  async       0              active
pg-cluster-3  0/8000000  0/8000000  0/8000000  0/8000000   00:00:00   00:00:00   00:00:00    streaming  async       0              active

Instances status
Name          Current LSN  Replication role  Status  QoS        Manager Version  Node
----          -----------  ----------------  ------  ---        ---------------  ----
pg-cluster-1  0/8000000    Primary           OK      Burstable  1.30.2           crc
pg-cluster-2  0/8000000    Standby (async)   OK      Burstable  1.30.2           crc
pg-cluster-3  0/8000000    Standby (async)   OK      Burstable  1.30.2           crc

PS C:\sw\openshift>
The output shows the PostgreSQL version, the current primary, the replication status of both standbys (streaming, async) and the state of each instance.
Connecting to the Database
The easiest way to get a psql session is the psql command of the plugin. It runs psql inside the primary pod and connects as the user postgres (the plugin calls kubectl exec, that’s why we created kubectl.exe above):
# PostgreSQL version and role of the instance (f = primary)
oc cnpg psql pg-cluster -- -c "select version();" -c "select pg_is_in_recovery();"
# replication status on the primary
oc cnpg psql pg-cluster -- -c "select application_name, state, sync_state from pg_stat_replication;"
# list the databases (app has been created by the operator)
oc cnpg psql pg-cluster -- -c "\l"
Sample Output (click to expand):
PS C:\sw\openshift> # PostgreSQL version and role of the instance (f = primary)
PS C:\sw\openshift> oc cnpg psql pg-cluster -- -c "select version();" -c "select pg_is_in_recovery();"
                                                      version
--------------------------------------------------------------------------------------------------------------------
 PostgreSQL 18.7 (Debian 18.7-1.pgdg13+2) on x86_64-pc-linux-gnu, compiled by gcc (Debian 14.2.0-19) 14.2.0, 64-bit
(1 row)

 pg_is_in_recovery
-------------------
 f
(1 row)

PS C:\sw\openshift> # replication status on the primary
PS C:\sw\openshift> oc cnpg psql pg-cluster -- -c "select application_name, state, sync_state from pg_stat_replication;"

 application_name |   state   | sync_state
------------------+-----------+------------
 pg-cluster-2     | streaming | async
 pg-cluster-3     | streaming | async
(2 rows)

PS C:\sw\openshift> # list the databases (app has been created by the operator)
PS C:\sw\openshift> oc cnpg psql pg-cluster -- -c "\l"
                                                List of databases
   Name    |  Owner   | Encoding | Locale Provider | Collate | Ctype | Locale | ICU Rules |   Access privileges
-----------+----------+----------+-----------------+---------+-------+--------+-----------+-----------------------
 app       | app      | UTF8     | libc            | C       | C     |        |           |
 postgres  | postgres | UTF8     | libc            | C       | C     |        |           |
 template0 | postgres | UTF8     | libc            | C       | C     |        |           | =c/postgres          +
           |          |          |                 |         |       |        |           | postgres=CTc/postgres
 template1 | postgres | UTF8     | libc            | C       | C     |        |           | =c/postgres          +
           |          |          |                 |         |       |        |           | postgres=CTc/postgres
(4 rows)

PS C:\sw\openshift>
To connect from Windows, for example with psql or pgAdmin, we need the password of the user app and a connection to the service. The password is stored (base64 encoded) in the secret pg-cluster-app, which also contains ready-to-use connection strings (keys uri and jdbc-uri):
# read the password of the user app from the secret
$pgpw = oc get secret pg-cluster-app -o jsonpath='{.data.password}'
$env:PGPASSWORD = [Text.Encoding]::UTF8.GetString([Convert]::FromBase64String($pgpw))
The database services are only reachable inside the OpenShift cluster. For testing we forward a local port to the read-write service in a second PowerShell window, which has to stay open. We use port 15432 to avoid conflicts with a local PostgreSQL installation:
# second PowerShell window (keep it open)
& crc oc-env | Invoke-Expression
# restart the port forwarding automatically if a connection breaks (stop with Ctrl+C)
while ($true) { oc port-forward -n pgdemo svc/pg-cluster-rw 15432:5432; Start-Sleep -Seconds 1 }
Now we connect with the Windows psql client (here from a PostgreSQL 18 installation in the default directory), create a table and insert some rows. The connection is encrypted: CloudNativePG creates the TLS certificates for each cluster automatically.
$psql = "C:\Program Files\pgAdmin 4\runtime\psql.exe"
$conn = "host=localhost port=15432 dbname=app user=app sslmode=require"
& $psql $conn -c "create table test (id int generated always as identity primary key, txt text, created timestamptz default now());"
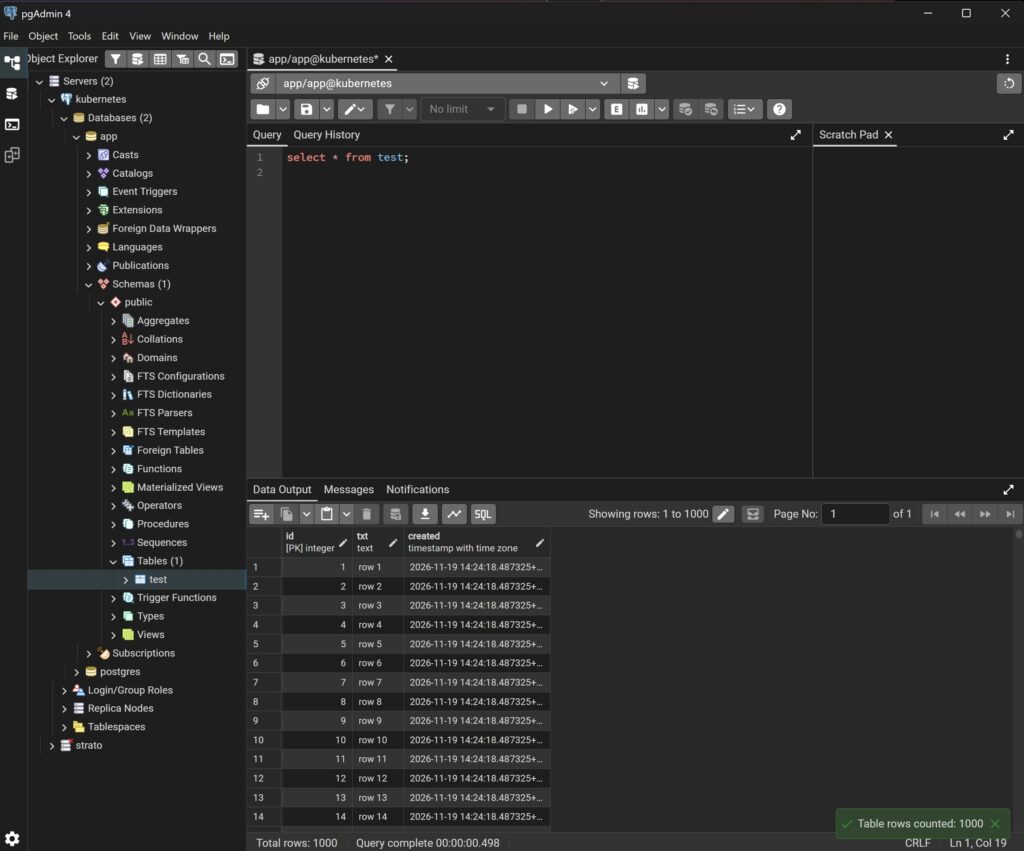
& $psql $conn -c "insert into test (txt) select 'row ' || g from generate_series(1,1000) g;"
& $psql $conn -c "select count(*), max(created) from test;"
Sample Output (click to expand):
PS C:\sw\openshift> $psql = "C:\Program Files\pgAdmin 4\runtime\psql.exe"
PS C:\sw\openshift> $conn = "host=localhost port=15432 dbname=app user=app sslmode=require"
PS C:\sw\openshift> & $psql $conn -c "create table test (id int generated always as identity primary key, txt text, created timestamptz default now());"
ERROR:  relation "test" already exists
PS C:\sw\openshift> & $psql $conn -c "insert into test (txt) select 'row ' || g from generate_series(1,1000) g;"
INSERT 0 1000
PS C:\sw\openshift> & $psql $conn -c "select count(*), max(created) from test;"
 count |              max
-------+-------------------------------
  1000 | 2026-11-19 14:24:18.487325+00
(1 row)


PS C:\sw\openshift>
In pgAdmin we register a new server with host localhost, port 15432, maintenance database app, user app, the password from the secret and SSL mode require.
Stop the while loop when finished.
Switchover and Failover
A switchover (planned change of the primary) is done with the promote command of the plugin. The role of each instance is also shown in the pod label cnpg.io/instanceRole:
# current roles: pg-cluster-1 is the primary
oc get pods -L cnpg.io/instanceRole
# switchover: promote instance 2 to the new primary
oc cnpg promote pg-cluster 2
# wait until pg-cluster-2 is the primary and the cluster is ready again
oc wait --for=jsonpath='{.status.currentPrimary}'=pg-cluster-2 cluster/pg-cluster --timeout=180s
oc wait --for=condition=Ready cluster/pg-cluster --timeout=300s
# pg-cluster-2 is the new primary, pg-cluster-1 has been restarted as standby
oc get pods -L cnpg.io/instanceRole
oc cnpg status pg-cluster
Sample Output (click to expand):
PS C:\sw\openshift> # current roles: pg-cluster-1 is the primary
PS C:\sw\openshift> oc get pods -L cnpg.io/instanceRole
NAME           READY   STATUS    RESTARTS        AGE   INSTANCEROLE
pg-cluster-1   1/1     Running   1 (4m55s ago)   66m   primary
pg-cluster-2   1/1     Running   1 (2m59s ago)   65m   replica
pg-cluster-3   1/1     Running   0               65m   replica
PS C:\sw\openshift> # switchover: promote instance 2 to the new primary
PS C:\sw\openshift> oc cnpg promote pg-cluster 2
{"level":"info","ts":"2026-11-19T15:33:48.3675842+01:00","msg":"Cluster has become unhealthy"}
Node pg-cluster-2 in cluster pg-cluster will be promoted
PS C:\sw\openshift> # wait until pg-cluster-2 is the primary and the cluster is ready again
PS C:\sw\openshift> oc wait --for=jsonpath='{.status.currentPrimary}'=pg-cluster-2 cluster/pg-cluster --timeout=180s
cluster.postgresql.cnpg.io/pg-cluster condition met
PS C:\sw\openshift> oc wait --for=condition=Ready cluster/pg-cluster --timeout=300s
cluster.postgresql.cnpg.io/pg-cluster condition met
PS C:\sw\openshift> # pg-cluster-2 is the new primary, pg-cluster-1 has been restarted as standby
PS C:\sw\openshift> oc get pods -L cnpg.io/instanceRole
NAME           READY   STATUS    RESTARTS        AGE   INSTANCEROLE
pg-cluster-1   1/1     Running   2 (15s ago)     66m   replica
pg-cluster-2   1/1     Running   1 (3m15s ago)   66m   primary
pg-cluster-3   1/1     Running   0               65m   replica
PS C:\sw\openshift> oc cnpg status pg-cluster
Cluster Summary
Name                     pgdemo/pg-cluster
System ID:               7709873658365100050
PostgreSQL Image:        ghcr.io/cloudnative-pg/postgresql:18.7-system-trixie
Primary instance:        pg-cluster-2
Primary promotion time:  2026-11-19 14:33:50 +0000 UTC (14s)
Status:                  Cluster in healthy state
Instances:               3
Ready instances:         3
Size:                    304M
Current Write LSN:       0/100030D8 (Timeline: 4 - WAL File: 000000040000000000000010)

Continuous Backup not configured

Streaming Replication status
Replication Slots Enabled
Name          Sent LSN    Write LSN   Flush LSN   Replay LSN  Write Lag        Flush Lag        Replay Lag       State      Sync State  Sync Priority  Replication Slot
----          --------    ---------   ---------   ----------  ---------        ---------        ----------       -----      ----------  -------------  ----------------
pg-cluster-1  0/100030D8  0/100030D8  0/100030D8  0/100030D8  00:00:00.208613  00:00:00.211985  00:00:00.213513  streaming  async       0              active
pg-cluster-3  0/100030D8  0/100030D8  0/100030D8  0/100030D8  00:00:00         00:00:00         00:00:00         streaming  async       0              active

Instances status
Name          Current LSN  Replication role  Status  QoS        Manager Version  Node
----          -----------  ----------------  ------  ---        ---------------  ----
pg-cluster-2  0/100030D8   Primary           OK      Burstable  1.30.2           crc
pg-cluster-1  0/100030D8   Standby (async)   OK      Burstable  1.30.2           crc
pg-cluster-3  0/100030D8   Standby (async)   OK      Burstable  1.30.2           crc

PS C:\sw\openshift>
The service pg-cluster-rw always points to the current primary, so applications inside the cluster reconnect to the new primary automatically. A running oc port-forward however stays bound to the pod it started with and must be restarted after a switchover.
To test an unplanned failover, we delete the pod of the current primary. The operator promotes the most advanced standby and recreates the deleted pod with its existing volume as a new standby:
# "crash" of the primary
oc delete pod pg-cluster-2 --wait=false
# watch the cluster status during the failover (stop with Ctrl+C)
oc get cluster pg-cluster -w
# the new roles
oc get pods -L cnpg.io/instanceRole
# the data is still there
oc cnpg psql pg-cluster -- -d app -c "select count(*) from test;"
Sample Output (click to expand):
PS C:\sw\openshift> # "crash" of the primary
PS C:\sw\openshift> oc delete pod pg-cluster-2 --wait=false
pod "pg-cluster-2" deleted from pgdemo namespace
PS C:\sw\openshift> # watch the cluster status during the failover (stop with Ctrl+C)
PS C:\sw\openshift> oc get cluster pg-cluster -w
NAME         AGE   INSTANCES   READY   STATUS         PRIMARY
pg-cluster   69m   3           2       Failing over   pg-cluster-2
pg-cluster   71m   3           2       Failing over   pg-cluster-2
pg-cluster   72m   3           2       Failing over   pg-cluster-2
pg-cluster   72m   3           2       Failing over   pg-cluster-2
pg-cluster   72m   3           2       Failing over   pg-cluster-2
pg-cluster   72m   3           2       Failing over   pg-cluster-2
pg-cluster   72m   3           2       Failing over   pg-cluster-2
pg-cluster   72m   3           2       Failing over   pg-cluster-1
pg-cluster   72m   3           2       Failing over   pg-cluster-1
pg-cluster   72m   3           2       Failing over   pg-cluster-1
pg-cluster   72m   3           2       Waiting for the instances to become active   pg-cluster-1
pg-cluster   72m   3           2       Waiting for the instances to become active   pg-cluster-1
pg-cluster   72m   3           2       Waiting for the instances to become active   pg-cluster-1
pg-cluster   72m   3           2       Waiting for the instances to become active   pg-cluster-1
pg-cluster   72m   3           3       Waiting for the instances to become active   pg-cluster-1
pg-cluster   72m   3           3       Cluster in healthy state                     pg-cluster-1
PS C:\sw\openshift> # the new roles
PS C:\sw\openshift> oc get pods -L cnpg.io/instanceRole
NAME           READY   STATUS    RESTARTS        AGE   INSTANCEROLE
pg-cluster-1   1/1     Running   2 (6m30s ago)   72m   primary
pg-cluster-2   1/1     Running   0               59s   replica
pg-cluster-3   1/1     Running   0               72m   replica
PS C:\sw\openshift> # the data is still there
PS C:\sw\openshift> oc cnpg psql pg-cluster -- -d app -c "select count(*) from test;"
 count
-------
  1000
(1 row)

PS C:\sw\openshift>
Monitoring with the OpenShift Monitoring Stack
Each PostgreSQL pod contains a Prometheus exporter on port 9187 (port name metrics), which provides a set of default metrics like replication lag, connections, database sizes and WAL archiving status. OpenShift comes with Prometheus, but OpenShift Local disables the cluster monitoring by default to save resources. Enabling it requires at least 14 GiB of memory for the VM and a restart of the cluster:
# memory of the OpenShift VM (at least 14336 MiB)
crc config get memory
crc stop
crc config set enable-cluster-monitoring true
crc start
Sample Output (click to expand):
PS C:\sw\openshift> # memory of the OpenShift VM (at least 14336 MiB)
PS C:\sw\openshift> crc config get memory
memory : 16384
PS C:\sw\openshift> crc stop
INFO Stopping the instance, this may take a few minutes...
Stopped the instance
PS C:\sw\openshift> crc config set enable-cluster-monitoring true
Successfully configured enable-cluster-monitoring to true
PS C:\sw\openshift> crc start
INFO Using bundle path C:\Users\User1\.crc\cache\crc_hyperv_5.0.0_amd64.crcbundle
INFO Checking minimum RAM requirements
INFO Checking if running in a shell with administrator rights
INFO Checking Windows release
INFO Checking Windows edition
INFO Checking if Hyper-V is installed and operational
INFO Checking if Hyper-V service is enabled
INFO Checking if crc-users group exists
INFO Checking if current user is in crc-users and Hyper-V admins group
INFO Checking if vsock is correctly configured
INFO Checking if the win32 background launcher is installed
INFO Checking if the daemon task is installed
INFO Checking if the daemon task is running
INFO Checking admin helper service is running
INFO Checking SSH port availability
INFO Loading bundle: crc_hyperv_5.0.0_amd64...
INFO Starting CRC VM for openshift 5.0.0...
INFO CRC instance is running with IP 127.0.0.1
INFO CRC VM is running
INFO Configuring shared directories
INFO Check internal and public DNS query...
INFO Check DNS query from host...
INFO Verifying validity of the kubelet certificates...
INFO Starting kubelet service
INFO Waiting for kube-apiserver availability... [takes around 2min]
INFO Overriding password for developer user
INFO Enabling cluster monitoring operator...
INFO Starting openshift instance... [waiting for the cluster to stabilize]
INFO All operators are available. Ensuring stability...
INFO 3 operators are progressing: openshift-controller-manager, operator-lifecycle-manager-packageserver, service-ca
INFO Operator authentication is not yet available
INFO All operators are available. Ensuring stability...
INFO Operators are stable (2/3)...
INFO Operators are stable (3/3)...
INFO Waiting until the user's pull secret is written to the instance disk...
INFO Adding crc-admin and crc-developer contexts to kubeconfig...
Started the OpenShift cluster.

The server is accessible via web console at:
  https://console-openshift-console.apps-crc.testing

Log in as administrator:
  Username: kubeadmin
  Password: xxxxx-xxxxx-xxxxx-xxxxx

Log in as user:
  Username: developer
  Password: developer

Use the 'oc' command line interface:
  PS> & crc oc-env | Invoke-Expression
  PS> oc login -u developer https://api.crc.testing:6443
PS C:\sw\openshift>
Important: once enabled, the monitoring can only be removed by setting the option back to false and recreating the cluster with crc delete.
The cluster monitoring only scrapes the OpenShift components. To scrape our own pods, we enable the monitoring for user-defined projects (user workload monitoring) as kubeadmin. If the ConfigMap cluster-monitoring-config already exists with other settings, we add the line with oc edit instead:
oc login -u kubeadmin https://api.crc.testing:6443
@'
apiVersion: v1
kind: ConfigMap
metadata:
  name: cluster-monitoring-config
  namespace: openshift-monitoring
data:
  config.yaml: |
    enableUserWorkload: true
'@ | oc apply -f -
# after a short time the Prometheus instance for user workloads is running
oc get pods -n openshift-user-workload-monitoring
Sample Output (click to expand):
PS C:\sw\openshift> oc login -u kubeadmin https://api.crc.testing:6443
Logged into "https://api.crc.testing:6443" as "kubeadmin" using existing credentials.

You have access to 67 projects, the list has been suppressed. You can list all projects with 'oc projects'

Using project "default".
PS C:\sw\openshift> @'
>> apiVersion: v1
>> kind: ConfigMap
>> metadata:
>>   name: cluster-monitoring-config
>>   namespace: openshift-monitoring
>> data:
>>   config.yaml: |
>>     enableUserWorkload: true
>> '@ | oc apply -f -
configmap/cluster-monitoring-config unchanged
PS C:\sw\openshift> # after a short time the Prometheus instance for user workloads is running
PS C:\sw\openshift> oc get pods -n openshift-user-workload-monitoring
NAME                                   READY   STATUS    RESTARTS   AGE
prometheus-operator-7bf6ccd5fc-6tvsq   2/2     Running   0          2m21s
prometheus-user-workload-0             6/6     Running   0          2m19s
thanos-ruler-user-workload-0           4/4     Running   0          2m18s
PS C:\sw\openshift>
Now we tell Prometheus which pods to scrape with a PodMonitor resource in our project. It selects all pods of the PostgreSQL cluster by the label cnpg.io/cluster:
@'
apiVersion: monitoring.coreos.com/v1
kind: PodMonitor
metadata:
  name: pg-cluster
  namespace: pgdemo
spec:
  selector:
    matchLabels:
      cnpg.io/cluster: pg-cluster
  podMetricsEndpoints:
  - port: metrics
'@ | oc apply -f -
oc get podmonitor -n pgdemo
Sample Output (click to expand):
PS C:\sw\openshift> @'
>> apiVersion: monitoring.coreos.com/v1
>> kind: PodMonitor
>> metadata:
>>   name: pg-cluster
>>   namespace: pgdemo
>> spec:
>>   selector:
>>     matchLabels:
>>       cnpg.io/cluster: pg-cluster
>>   podMetricsEndpoints:
>>   - port: metrics
>> '@ | oc apply -f -
podmonitor.monitoring.coreos.com/pg-cluster created
PS C:\sw\openshift> oc get podmonitor -n pgdemo
NAME         AGE
pg-cluster   5s
PS C:\sw\openshift>
The exporter can also be tested directly. Again we need a port forward in a second PowerShell window:
# second PowerShell window (keep it open)
oc port-forward -n pgdemo pod/pg-cluster-1 19187:9187
# first window: show some of the metrics
curl.exe -s http://localhost:19187/metrics | Select-String "cnpg_collector_up|cnpg_pg_replication_lag|cnpg_backends_total"
Sample Output of curl (click to expand):
PS C:\sw\openshift> curl.exe -s http://localhost:19187/metrics | Select-String "cnpg_collector_up|cnpg_pg_replication_lag|cnpg_backends_total"

# HELP cnpg_backends_total Number of backends
# TYPE cnpg_backends_total gauge
cnpg_backends_total{application_name="cnpg_metrics_exporter",datname="app",state="active",usename="cnpg_metrics_exporte
r"} 1
cnpg_backends_total{application_name="pg-cluster-2",datname="",state="active",usename="streaming_replica"} 1
cnpg_backends_total{application_name="pg-cluster-3",datname="",state="active",usename="streaming_replica"} 1
# HELP cnpg_collector_up 1 if PostgreSQL is up, 0 otherwise.
# TYPE cnpg_collector_up gauge
cnpg_collector_up{cluster="pg-cluster"} 1
# HELP cnpg_pg_replication_lag Replication lag behind primary in seconds
# TYPE cnpg_pg_replication_lag gauge
cnpg_pg_replication_lag 0


PS C:\sw\openshift>
After one or two minutes the metrics are available in the web console under Observe => Metrics. Some useful queries:
cnpg_collector_up{namespace="pgdemo"}: 1 if the exporter can connect to PostgreSQLcnpg_pg_replication_lag{namespace="pgdemo"}: replication lag of the standbys in secondscnpg_backends_total{namespace="pgdemo"}: number of connections per database and usercnpg_pg_database_size_bytes{namespace="pgdemo"}: size of the databases
The CloudNativePG documentation also provides a Grafana dashboard and Prometheus alerting rules, which can be used with an own Grafana instance.
Cleaning Up
To remove everything we delete the PostgreSQL cluster, the project and the operator:
# delete the PostgreSQL cluster including pods, services, secrets and PVCs
oc delete cluster pg-cluster -n pgdemo
# delete the project
oc delete project pgdemo
# remove the operator (this deletes the CRDs and with them all remaining PostgreSQL clusters!)
oc delete -f https://raw.githubusercontent.com/cloudnative-pg/cloudnative-pg/release-1.30/releases/cnpg-1.30.2.yaml
Sample Output (click to expand):
PS C:\sw\openshift> # delete the PostgreSQL cluster including pods, services, secrets and PVCs
PS C:\sw\openshift> oc delete cluster pg-cluster -n pgdemo
cluster.postgresql.cnpg.io "pg-cluster" deleted from pgdemo namespace
PS C:\sw\openshift> # delete the project
PS C:\sw\openshift> oc delete project pgdemo
project.project.openshift.io "pgdemo" deleted
PS C:\sw\openshift> # remove the operator (this deletes the CRDs and with them all remaining PostgreSQL clusters!)
PS C:\sw\openshift> oc delete -f https://raw.githubusercontent.com/cloudnative-pg/cloudnative-pg/release-1.30/releases/cnpg-1.30.2.yaml
namespace "cnpg-system" deleted
customresourcedefinition.apiextensions.k8s.io "backups.postgresql.cnpg.io" deleted
customresourcedefinition.apiextensions.k8s.io "clusterimagecatalogs.postgresql.cnpg.io" deleted
customresourcedefinition.apiextensions.k8s.io "clusters.postgresql.cnpg.io" deleted
customresourcedefinition.apiextensions.k8s.io "databaseroles.postgresql.cnpg.io" deleted
customresourcedefinition.apiextensions.k8s.io "databases.postgresql.cnpg.io" deleted
customresourcedefinition.apiextensions.k8s.io "failoverquorums.postgresql.cnpg.io" deleted
customresourcedefinition.apiextensions.k8s.io "imagecatalogs.postgresql.cnpg.io" deleted
customresourcedefinition.apiextensions.k8s.io "poolers.postgresql.cnpg.io" deleted
customresourcedefinition.apiextensions.k8s.io "publications.postgresql.cnpg.io" deleted
customresourcedefinition.apiextensions.k8s.io "scheduledbackups.postgresql.cnpg.io" deleted
customresourcedefinition.apiextensions.k8s.io "subscriptions.postgresql.cnpg.io" deleted
serviceaccount "cnpg-manager" deleted from cnpg-system namespace
clusterrole.rbac.authorization.k8s.io "cnpg-database-editor-role" deleted
clusterrole.rbac.authorization.k8s.io "cnpg-database-viewer-role" deleted
clusterrole.rbac.authorization.k8s.io "cnpg-manager" deleted
clusterrole.rbac.authorization.k8s.io "cnpg-publication-editor-role" deleted
clusterrole.rbac.authorization.k8s.io "cnpg-publication-viewer-role" deleted
clusterrole.rbac.authorization.k8s.io "cnpg-subscription-editor-role" deleted
clusterrole.rbac.authorization.k8s.io "cnpg-subscription-viewer-role" deleted
clusterrolebinding.rbac.authorization.k8s.io "cnpg-manager-rolebinding" deleted
configmap "cnpg-default-monitoring" deleted from cnpg-system namespace
service "cnpg-webhook-service" deleted from cnpg-system namespace
deployment.apps "cnpg-controller-manager" deleted from cnpg-system namespace
mutatingwebhookconfiguration.admissionregistration.k8s.io "cnpg-mutating-webhook-configuration" deleted
validatingwebhookconfiguration.admissionregistration.k8s.io "cnpg-validating-webhook-configuration" deleted
PS C:\sw\openshift>
The files kubectl-cnpg.exe and kubectl.exe in $HOME\bin can simply be deleted.
Troubleshooting
- Pods stay in status Pending: check the PVCs with
oc get pvcand the events withoc get events --sort-by=.lastTimestamp. Often the VM has not enough memory or CPUs for the resource requests - ImagePullBackOff: the cluster cannot reach ghcr.io (proxy or firewall)
- Pods are rejected because of a security context constraint: check the events and the operator log with
oc logs -n cnpg-system deployment/cnpg-controller-manager - The cluster hangs in a phase like “Setting up primary”: show the logs of all instances with
oc cnpg logs cluster pg-cluster | oc cnpg logs pretty oc cnpg psqlfails because kubectl cannot be found: copy oc.exe as kubectl.exe into a directory in the PATH (see “Installing the cnpg Plugin”)- psql from Windows fails after a switchover or failover: restart the
oc port-forward - For a support request:
oc cnpg report operator -n cnpg-systemandoc cnpg report cluster pg-cluster --logscreate ZIP files with all relevant information
References
- CloudNativePG homepage
- CloudNativePG 1.30 documentation
- CloudNativePG installation and upgrades
- CloudNativePG kubectl plugin
- CloudNativePG monitoring
- CloudNativePG 1.30.2 release on GitHub
- OpenShift Local documentation (monitoring: Administrative tasks)
- Install RedHat OpenShift Local on Windows 11
Have fun 🙂
Leave a Reply