PostgreSQL IO monitoring

Measuring PostgreSQL per process I/O throughput

PostgreSQL provides excellent monitoring capabilities, but sometimes you need to know something more specific:

Which PostgreSQL process is responsible for the current disk I/O?

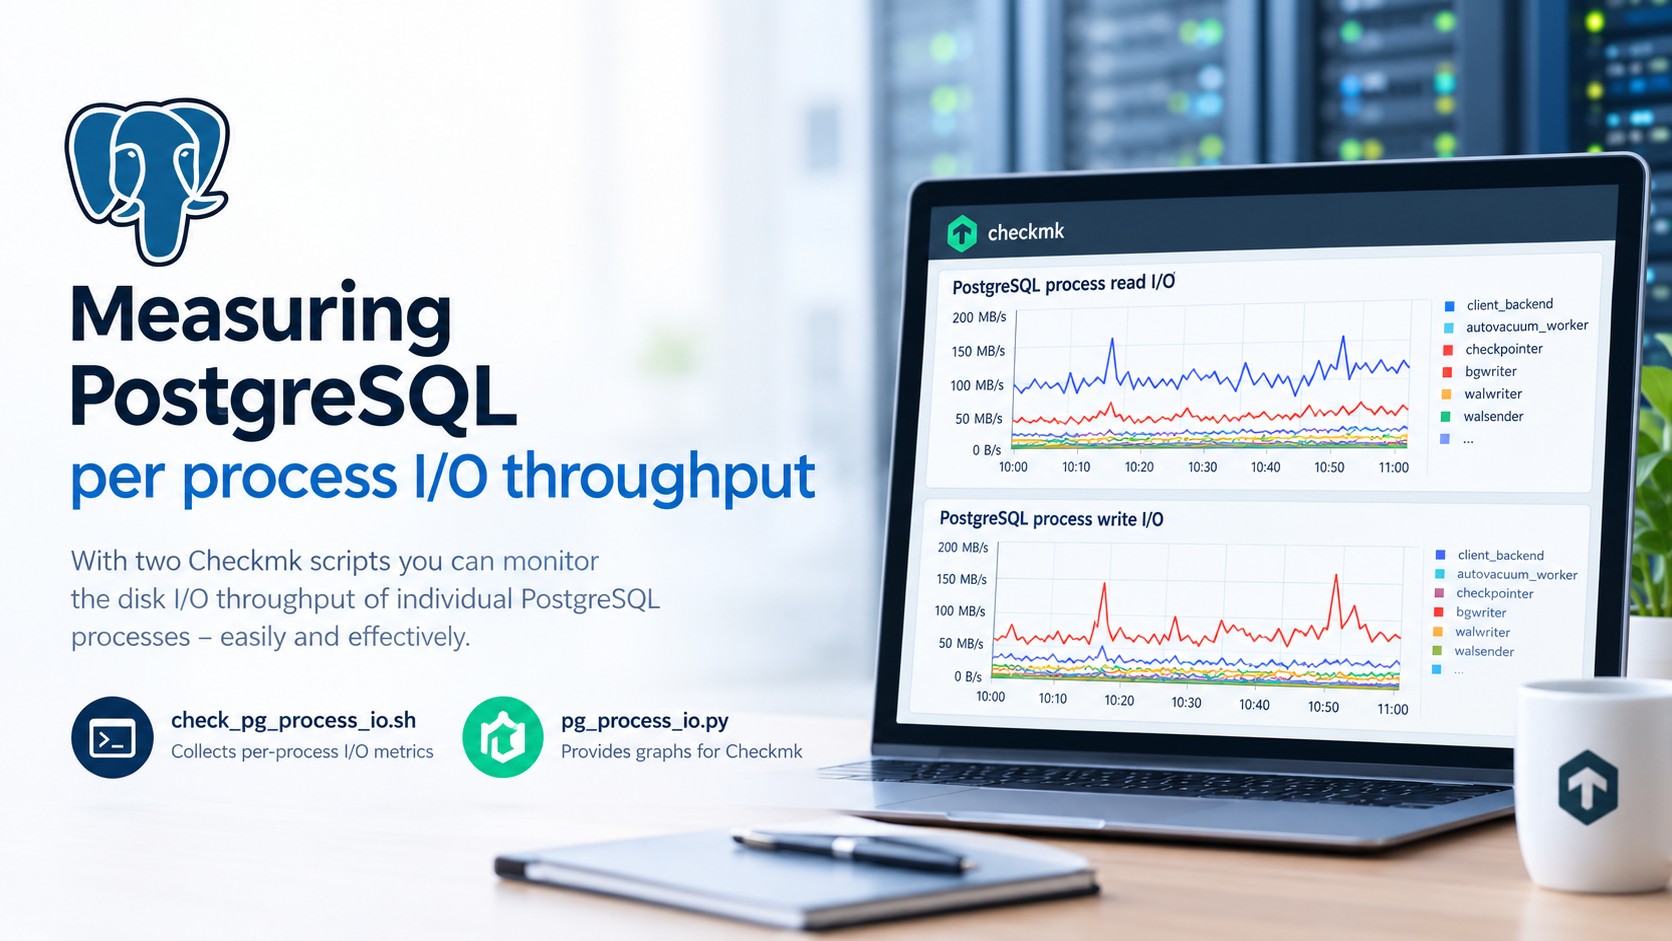
With two small Checkmk scripts, you can monitor the I/O throughput of individual PostgreSQL processes and visualize the results directly in Checkmk.

Why monitor PostgreSQL process I/O?

Looking only at the overall database I/O can make it difficult to understand what is happening on a busy PostgreSQL server. Different PostgreSQL processes have very different responsibilities. For example:

  • client_backend processes handle client connections
  • checkpointer writes dirty buffers to disk
  • bgwriter performs background writes
  • walwriter writes WAL data
  • walsender processes handle WAL streaming
  • autovacuum_worker processes perform automatic maintenance
  • parallel workers and PostgreSQL I/O workers can also contribute significantly to the I/O load

Having these processes visible separately in Checkmk makes unusual I/O activity much easier to identify.

The Checkmk local check

The first script is:

/usr/lib/check_mk_agent/local/check_pg_process_io.sh

The script reads the Linux process I/O counters from:

/proc/<pid>/io

For each PostgreSQL process, it determines the process role, for example checkpointer, walwriter, autovacuum_worker or client_backend.

Processes belonging to the same role are aggregated. The script stores the previous cumulative counters and calculates the difference over time to determine the current I/O throughput in bytes per second.

Both read and write throughput are exported as Checkmk performance data.

Script: (click to expand)
#!/usr/bin/bash
# ---------------------------------------------------------------------------
# Checkmk local check: per-process disk I/O for all PostgreSQL processes.
#
# Emits ONE service whose perfdata contains both read and write metrics:
#   read_bytes_<role>   -> graph "PostgreSQL process read I/O"
#   write_bytes_<role>  -> graph "PostgreSQL process write I/O"
# One line per PostgreSQL role in each graph.
#
# IMPORTANT: perfdata items are separated by '|' (pipe), as required by the
# Checkmk local check protocol.
#
# Install: /usr/lib/check_mk_agent/local/check_pg_process_io.sh  (chmod 0700)
# Requires: bash 4+, Checkmk agent running as root (to read /proc/<pid>/io)
# ---------------------------------------------------------------------------

# ---------------------------- CONFIG ---------------------------------------
PG_USER="postgres"
WARN_BPS=$((10 * 1024 * 1024))     # 10 MB/s per series
CRIT_BPS=$((50 * 1024 * 1024))     # 50 MB/s per series
SKIP_NON_SERVER_PROCS="true"       # true  -> drop psql / bash / (sd-pam)
STATE_ROOT="/var/lib/check_mk_agent/pg_proc_io"
SERVICE_NAME="PostgreSQL process I/O"
# ---------------------------------------------------------------------------

NOW=$(date +%s)
mkdir -p "$STATE_ROOT/read_bytes" "$STATE_ROOT/write_bytes" 2>/dev/null

# Map a cmdline like "postgres: 18/main: checkpointer process" to a stable
# role label such as "checkpointer". Handles PG 9.x .. 18+ naming schemes,
# PG 18 io workers / walsummarizer, and PG 18 client backends (which no
# longer use the "client backend" keyword on the cmdline).
#
# Returns non-zero if the process should be skipped.
normalize_role() {
    local cmd
    cmd=$(printf '%s' "$1" \
        | sed -E 's/^postgres:[[:space:]]*//' \
        | sed -E 's/^[0-9]+(\/[^:[:space:]]+)?:[[:space:]]*//' \
        | sed -E 's/[[:space:]]+process$//' \
        | sed -E 's/[[:space:]]+$//')

    case "$cmd" in
        # --- named PostgreSQL roles -------------------------------------
        "background writer")                     echo "bgwriter";;
        "autovacuum worker"*)                    echo "autovacuum_worker";;
        "autovacuum launcher")                   echo "autovacuum_launcher";;
        "logical replication launcher")          echo "logical_replication_launcher";;
        "logical replication tablesync worker"*) echo "logical_replication_tablesync_worker";;
        "logical replication worker"*)           echo "logical_replication_worker";;
        "parallel worker"*)                      echo "parallel_worker";;
        "checkpointer")                          echo "checkpointer";;
        "walwriter")                             echo "walwriter";;
        "walsender")                             echo "walsender";;
        "walreceiver")                           echo "walreceiver";;
        "archiver")                              echo "archiver";;
        "startup")                               echo "startup";;

        # --- PostgreSQL 18+ new process types ---------------------------
        "io worker "*)                           echo "$(printf '%s' "$cmd" | tr ' ' '_')";;
        "walsummarizer")                         echo "walsummarizer";;

        # --- postmaster (raw binary path, no "postgres:" prefix) -------
        */bin/postgres\ -*)                      echo "postmaster";;
        "postgres"|"")                           echo "postmaster";;

        # --- non-server processes owned by the postgres user -----------
        "psql"*|"bash"|"sh"|"-bash"|"-sh"|"(sd-pam)"|"sd-pam")
            if [ "$SKIP_NON_SERVER_PROCS" = "true" ]; then
                return 1
            fi
            printf '%s' "$cmd" | sed 's/[^A-Za-z0-9_]/_/g'
            ;;

        # --- anything else with multiple fields = client backend --------
        *[[:space:]]*)                           echo "client_backend";;

        # --- truly unknown: sanitised as-is ----------------------------
        *) printf '%s' "$cmd" | sed 's/[^A-Za-z0-9_]/_/g';;
    esac
}

# -------- Collect cumulative read/write counters per role --------
declare -A READ_TOTALS=()
declare -A WRITE_TOTALS=()

for PID in $(pgrep -u "$PG_USER" 2>/dev/null); do
    IO_FILE="/proc/$PID/io"
    [ -r "$IO_FILE" ] || continue

    R=$(awk '/^read_bytes:/  {print $2}' "$IO_FILE" 2>/dev/null)
    W=$(awk '/^write_bytes:/ {print $2}' "$IO_FILE" 2>/dev/null)
    [ -z "$R" ] && continue
    [ -z "$W" ] && W=0

    CMD=$(tr '\0' ' ' < "/proc/$PID/cmdline" 2>/dev/null | sed 's/[[:space:]]*$//')
    [ -z "$CMD" ] && CMD=$(cat "/proc/$PID/comm" 2>/dev/null)

    ROLE=$(normalize_role "$CMD") || continue

    # All PIDs of the same role are summed into one metric.
    READ_TOTALS[$ROLE]=$(( ${READ_TOTALS[$ROLE]:-0} + R ))
    WRITE_TOTALS[$ROLE]=$(( ${WRITE_TOTALS[$ROLE]:-0} + W ))
done

if [ "${#READ_TOTALS[@]}" -eq 0 ]; then
    echo "3 \"$SERVICE_NAME\" - No readable PostgreSQL processes (agent must run as root)"
    exit 0
fi

# -------- Compute rates and build perfdata --------
# Perfdata items are separated by '|' (pipe), as required by Checkmk.
PERFDATA=""
WORST=0

compute_rate() {
    local STATE_FILE="$1" CUR="$2"
    local LAST=0 LAST_TS=0
    if [ -f "$STATE_FILE" ]; then
        read -r LAST LAST_TS < "$STATE_FILE" 2>/dev/null || true
        LAST=${LAST:-0}; LAST_TS=${LAST_TS:-0}
    fi
    printf '%s %s\n' "$CUR" "$NOW" > "$STATE_FILE"
    [ "$LAST_TS" -eq 0 ] && return
    local DT=$((NOW - LAST_TS))
    [ "$DT" -le 0 ] && return
    local DB=$((CUR - LAST))
    [ "$DB" -lt 0 ] && DB=0
    echo $((DB / DT))
}

for ROLE in "${!READ_TOTALS[@]}"; do
    R_RATE=$(compute_rate "$STATE_ROOT/read_bytes/$ROLE"  "${READ_TOTALS[$ROLE]}")
    W_RATE=$(compute_rate "$STATE_ROOT/write_bytes/$ROLE" "${WRITE_TOTALS[$ROLE]:-0}")

    [ -n "$R_RATE" ] && PERFDATA="${PERFDATA}read_bytes_${ROLE}=${R_RATE}B/s;${WARN_BPS};${CRIT_BPS}|"
    [ -n "$W_RATE" ] && PERFDATA="${PERFDATA}write_bytes_${ROLE}=${W_RATE}B/s;${WARN_BPS};${CRIT_BPS}|"

    for RATE in "$R_RATE" "$W_RATE"; do
        [ -z "$RATE" ] && continue
        if   [ "$RATE" -ge "$CRIT_BPS" ]; then WORST=2
        elif [ "$RATE" -ge "$WARN_BPS" ] && [ "$WORST" -lt 2 ]; then WORST=1
        fi
    done
done

# -------- Drop state for roles that no longer exist --------
for METRIC_DIR in "$STATE_ROOT/read_bytes" "$STATE_ROOT/write_bytes"; do
    for f in "$METRIC_DIR"/*; do
        [ -f "$f" ] || continue
        base=$(basename "$f")
        keep=0
        for ROLE in "${!READ_TOTALS[@]}"; do
            [ "$ROLE" = "$base" ] && keep=1 && break
        done
        [ "$keep" -eq 0 ] && rm -f "$f"
    done
done

case $WORST in
    2) TXT="CRITICAL";;
    1) TXT="WARNING";;
    *) TXT="OK";;
esac

if [ -z "$PERFDATA" ]; then
    echo "0 \"$SERVICE_NAME\" - Initializing (waiting for second sample)"
    exit 0
fi

# Strip the trailing pipe
PERFDATA="${PERFDATA%|}"

echo "$WORST \"$SERVICE_NAME\" ${PERFDATA} ${TXT} - read/write bytes/s per PostgreSQL process"

Configurable thresholds

The script uses configurable warning and critical thresholds:

WARN_MBPS=10
CRIT_MBPS=50

This allows Checkmk to report a warning or critical state when an individual PostgreSQL process role exceeds the configured I/O throughput.

The Checkmk agent must run with sufficient privileges to read /proc/<pid>/io.

The Checkmk graphing plugin

The second script is:

~/local/lib/python3/cmk_addons/plugins/pg_process_io/graphing/pg_process_io.py (owner: mon group: mon file mode: 0600)

This Python plugin defines the Checkmk metrics for the different PostgreSQL process roles and creates two graphs.

Script: (click to expand):
#!/usr/bin/env python3
# ~/local/lib/python3/cmk_addons/plugins/pg_process_io/graphing/pg_process_io.py
# s.a. https://docs.checkmk.com/plugin-api/latest/cmk.graphing/v1.graphs.html#cmk.graphing.v1.graphs.Graph

from cmk.graphing.v1 import Title
from cmk.graphing.v1.graphs import Graph, MinimalRange
from cmk.graphing.v1.metrics import Color, IECNotation, Metric, Unit

UNIT_BPS = Unit(IECNotation("B/s"))

# ---------------------------------------------------------------
# Read metrics (one per PostgreSQL role)
# ---------------------------------------------------------------
metric_read_bytes_postmaster = Metric(
    name="read_bytes_postmaster",
    title=Title("Read postmaster"),
    unit=UNIT_BPS,
    color=Color.LIGHT_RED,
)
metric_read_bytes_checkpointer = Metric(
    name="read_bytes_checkpointer",
    title=Title("Read checkpointer"),
    unit=UNIT_BPS,
    color=Color.RED,
)
metric_read_bytes_bgwriter = Metric(
    name="read_bytes_bgwriter",
    title=Title("Read bgwriter"),
    unit=UNIT_BPS,
    color=Color.DARK_RED,
)
metric_read_bytes_walwriter = Metric(
    name="read_bytes_walwriter",
    title=Title("Read walwriter"),
    unit=UNIT_BPS,
    color=Color.LIGHT_ORANGE,
)
metric_read_bytes_walsender = Metric(
    name="read_bytes_walsender",
    title=Title("Read walsender"),
    unit=UNIT_BPS,
    color=Color.ORANGE,
)
metric_read_bytes_walreceiver = Metric(
    name="read_bytes_walreceiver",
    title=Title("Read walreceiver"),
    unit=UNIT_BPS,
    color=Color.DARK_ORANGE,
)
metric_read_bytes_archiver = Metric(
    name="read_bytes_archiver",
    title=Title("Read archiver"),
    unit=UNIT_BPS,
    color=Color.LIGHT_YELLOW,
)
metric_read_bytes_startup = Metric(
    name="read_bytes_startup",
    title=Title("Read startup"),
    unit=UNIT_BPS,
    color=Color.YELLOW,
)
metric_read_bytes_io_worker_0 = Metric(
    name="read_bytes_io_worker_0",
    title=Title("Read io_worker_0"),
    unit=UNIT_BPS,
    color=Color.DARK_YELLOW,
)
metric_read_bytes_io_worker_1 = Metric(
    name="read_bytes_io_worker_1",
    title=Title("Read io_worker_1"),
    unit=UNIT_BPS,
    color=Color.LIGHT_GREEN,
)
metric_read_bytes_io_worker_2 = Metric(
    name="read_bytes_io_worker_2",
    title=Title("Read io_worker_2"),
    unit=UNIT_BPS,
    color=Color.GREEN,
)
metric_read_bytes_walsummarizer = Metric(
    name="read_bytes_walsummarizer",
    title=Title("Read walsummarizer"),
    unit=UNIT_BPS,
    color=Color.DARK_GREEN,
)
metric_read_bytes_autovacuum_launcher = Metric(
    name="read_bytes_autovacuum_launcher",
    title=Title("Read autovacuum_launcher"),
    unit=UNIT_BPS,
    color=Color.LIGHT_BLUE,
)
metric_read_bytes_autovacuum_worker = Metric(
    name="read_bytes_autovacuum_worker",
    title=Title("Read autovacuum_worker"),
    unit=UNIT_BPS,
    color=Color.BLUE,
)
metric_read_bytes_logical_replication_launcher = Metric(
    name="read_bytes_logical_replication_launcher",
    title=Title("Read logical_replication_launcher"),
    unit=UNIT_BPS,
    color=Color.DARK_BLUE,
)
metric_read_bytes_logical_replication_worker = Metric(
    name="read_bytes_logical_replication_worker",
    title=Title("Read logical_replication_worker"),
    unit=UNIT_BPS,
    color=Color.LIGHT_CYAN,
)
metric_read_bytes_logical_replication_tablesync_worker = Metric(
    name="read_bytes_logical_replication_tablesync_worker",
    title=Title("Read logical_replication_tablesync_worker"),
    unit=UNIT_BPS,
    color=Color.CYAN,
)
metric_read_bytes_parallel_worker = Metric(
    name="read_bytes_parallel_worker",
    title=Title("Read parallel_worker"),
    unit=UNIT_BPS,
    color=Color.DARK_CYAN,
)
metric_read_bytes_client_backend = Metric(
    name="read_bytes_client_backend",
    title=Title("Read client_backend"),
    unit=UNIT_BPS,
    color=Color.LIGHT_PURPLE,
)

# ---------------------------------------------------------------
# Write metrics (one per PostgreSQL role)
# ---------------------------------------------------------------
metric_write_bytes_postmaster = Metric(
    name="write_bytes_postmaster",
    title=Title("Write postmaster"),
    unit=UNIT_BPS,
    color=Color.LIGHT_RED,
)
metric_write_bytes_checkpointer = Metric(
    name="write_bytes_checkpointer",
    title=Title("Write checkpointer"),
    unit=UNIT_BPS,
    color=Color.RED,
)
metric_write_bytes_bgwriter = Metric(
    name="write_bytes_bgwriter",
    title=Title("Write bgwriter"),
    unit=UNIT_BPS,
    color=Color.DARK_RED,
)
metric_write_bytes_walwriter = Metric(
    name="write_bytes_walwriter",
    title=Title("Write walwriter"),
    unit=UNIT_BPS,
    color=Color.LIGHT_ORANGE,
)
metric_write_bytes_walsender = Metric(
    name="write_bytes_walsender",
    title=Title("Write walsender"),
    unit=UNIT_BPS,
    color=Color.ORANGE,
)
metric_write_bytes_walreceiver = Metric(
    name="write_bytes_walreceiver",
    title=Title("Write walreceiver"),
    unit=UNIT_BPS,
    color=Color.DARK_ORANGE,
)
metric_write_bytes_archiver = Metric(
    name="write_bytes_archiver",
    title=Title("Write archiver"),
    unit=UNIT_BPS,
    color=Color.LIGHT_YELLOW,
)
metric_write_bytes_startup = Metric(
    name="write_bytes_startup",
    title=Title("Write startup"),
    unit=UNIT_BPS,
    color=Color.YELLOW,
)
metric_write_bytes_io_worker_0 = Metric(
    name="write_bytes_io_worker_0",
    title=Title("Write io_worker_0"),
    unit=UNIT_BPS,
    color=Color.DARK_YELLOW,
)
metric_write_bytes_io_worker_1 = Metric(
    name="write_bytes_io_worker_1",
    title=Title("Write io_worker_1"),
    unit=UNIT_BPS,
    color=Color.LIGHT_GREEN,
)
metric_write_bytes_io_worker_2 = Metric(
    name="write_bytes_io_worker_2",
    title=Title("Write io_worker_2"),
    unit=UNIT_BPS,
    color=Color.GREEN,
)
metric_write_bytes_walsummarizer = Metric(
    name="write_bytes_walsummarizer",
    title=Title("Write walsummarizer"),
    unit=UNIT_BPS,
    color=Color.DARK_GREEN,
)
metric_write_bytes_autovacuum_launcher = Metric(
    name="write_bytes_autovacuum_launcher",
    title=Title("Write autovacuum_launcher"),
    unit=UNIT_BPS,
    color=Color.LIGHT_BLUE,
)
metric_write_bytes_autovacuum_worker = Metric(
    name="write_bytes_autovacuum_worker",
    title=Title("Write autovacuum_worker"),
    unit=UNIT_BPS,
    color=Color.BLUE,
)
metric_write_bytes_logical_replication_launcher = Metric(
    name="write_bytes_logical_replication_launcher",
    title=Title("Write logical_replication_launcher"),
    unit=UNIT_BPS,
    color=Color.DARK_BLUE,
)
metric_write_bytes_logical_replication_worker = Metric(
    name="write_bytes_logical_replication_worker",
    title=Title("Write logical_replication_worker"),
    unit=UNIT_BPS,
    color=Color.LIGHT_CYAN,
)
metric_write_bytes_logical_replication_tablesync_worker = Metric(
    name="write_bytes_logical_replication_tablesync_worker",
    title=Title("Write logical_replication_tablesync_worker"),
    unit=UNIT_BPS,
    color=Color.CYAN,
)
metric_write_bytes_parallel_worker = Metric(
    name="write_bytes_parallel_worker",
    title=Title("Write parallel_worker"),
    unit=UNIT_BPS,
    color=Color.DARK_CYAN,
)
metric_write_bytes_client_backend = Metric(
    name="write_bytes_client_backend",
    title=Title("Write client_backend"),
    unit=UNIT_BPS,
    color=Color.LIGHT_PURPLE,
)

# ---------------------------------------------------------------
# Combined graphs
# ---------------------------------------------------------------
graph_pg_process_read_bytes = Graph(
    name="pg_process_read_bytes",
    title=Title("PostgreSQL process read I/O"),
    simple_lines=[
        "read_bytes_archiver",
        "read_bytes_autovacuum_launcher",
        "read_bytes_autovacuum_worker",
        "read_bytes_bgwriter",
        "read_bytes_checkpointer",
        "read_bytes_client_backend",
        "read_bytes_io_worker_0",
        "read_bytes_io_worker_1",
        "read_bytes_io_worker_2",
        "read_bytes_logical_replication_launcher",
        "read_bytes_logical_replication_tablesync_worker",
        "read_bytes_logical_replication_worker",
        "read_bytes_parallel_worker",
        "read_bytes_postmaster",
        "read_bytes_startup",
        "read_bytes_walreceiver",
        "read_bytes_walsender",
        "read_bytes_walsummarizer",
        "read_bytes_walwriter",
    ],
    optional=[
        "read_bytes_archiver",
        "read_bytes_autovacuum_launcher",
        "read_bytes_autovacuum_worker",
        "read_bytes_bgwriter",
        "read_bytes_checkpointer",
        "read_bytes_client_backend",
        "read_bytes_io_worker_0",
        "read_bytes_io_worker_1",
        "read_bytes_io_worker_2",
        "read_bytes_logical_replication_launcher",
        "read_bytes_logical_replication_tablesync_worker",
        "read_bytes_logical_replication_worker",
        "read_bytes_parallel_worker",
        "read_bytes_postmaster",
        "read_bytes_startup",
        "read_bytes_walreceiver",
        "read_bytes_walsender",
        "read_bytes_walsummarizer",
        "read_bytes_walwriter",
    ],
)

graph_pg_process_write_bytes = Graph(
    name="pg_process_write_bytes",
    title=Title("PostgreSQL process write I/O"),
    simple_lines=[
        "write_bytes_archiver",
        "write_bytes_autovacuum_launcher",
        "write_bytes_autovacuum_worker",
        "write_bytes_bgwriter",
        "write_bytes_checkpointer",
        "write_bytes_client_backend",
        "write_bytes_io_worker_0",
        "write_bytes_io_worker_1",
        "write_bytes_io_worker_2",
        "write_bytes_logical_replication_launcher",
        "write_bytes_logical_replication_tablesync_worker",
        "write_bytes_logical_replication_worker",
        "write_bytes_parallel_worker",
        "write_bytes_postmaster",
        "write_bytes_startup",
        "write_bytes_walreceiver",
        "write_bytes_walsender",
        "write_bytes_walsummarizer",
        "write_bytes_walwriter",
    ],
    optional=[
        "write_bytes_archiver",
        "write_bytes_autovacuum_launcher",
        "write_bytes_autovacuum_worker",
        "write_bytes_bgwriter",
        "write_bytes_checkpointer",
        "write_bytes_client_backend",
        "write_bytes_io_worker_0",
        "write_bytes_io_worker_1",
        "write_bytes_io_worker_2",
        "write_bytes_logical_replication_launcher",
        "write_bytes_logical_replication_tablesync_worker",
        "write_bytes_logical_replication_worker",
        "write_bytes_parallel_worker",
        "write_bytes_postmaster",
        "write_bytes_startup",
        "write_bytes_walreceiver",
        "write_bytes_walsender",
        "write_bytes_walsummarizer",
        "write_bytes_walwriter",
    ],
)

PostgreSQL process read I/O

The first graph shows the read throughput of the individual PostgreSQL process types.
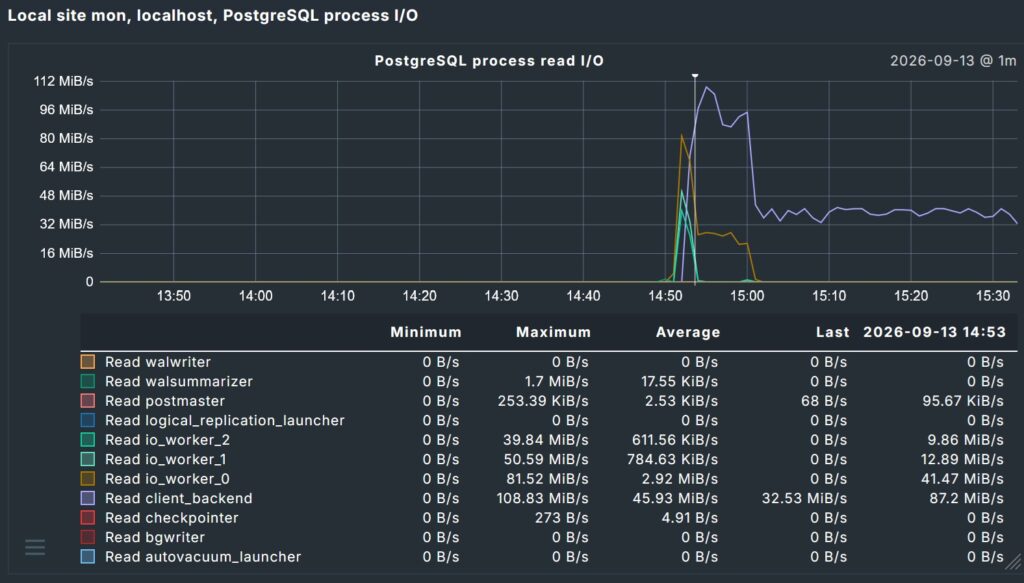
This makes it possible to see, for example, whether a sudden increase in database read activity is coming from client backends, autovacuum workers, the checkpointer or another PostgreSQL process.

PostgreSQL process write I/O

The second graph shows the corresponding write throughput.
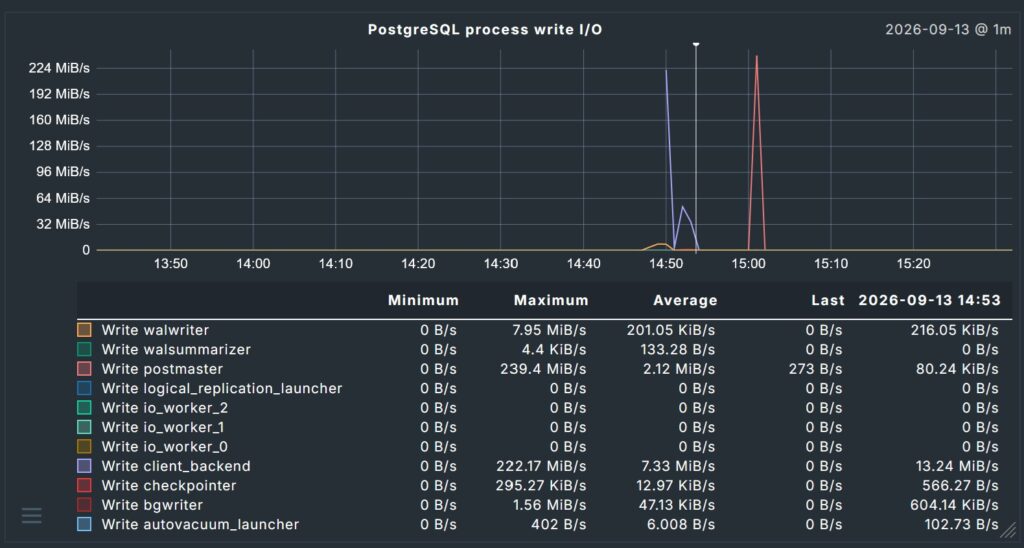
This is particularly useful when investigating high write activity caused by checkpoints, WAL processing, autovacuum or application workloads.

What you get in Checkmk

The local check creates a Checkmk service called: PostgreSQL process I/O

The service provides performance data for the different PostgreSQL process roles. The graphing plugin then presents the data as two separate graphs:

PostgreSQL process read I/O

and

PostgreSQL process write I/O

Instead of looking at a single aggregated database I/O value, you can see which PostgreSQL process role is responsible for the activity.

Supported PostgreSQL processes

The graphing plugin includes metrics for process types such as:

  • postmaster
  • checkpointer
  • bgwriter
  • walwriter
  • walsender
  • walreceiver
  • archiver
  • startup
  • io_worker_0
  • io_worker_1
  • io_worker_2
  • walsummarizer
  • autovacuum_launcher
  • autovacuum_worker
  • logical_replication_launcher
  • logical_replication_worker
  • tablesync_worker
  • parallel_worker
  • client_backend

This also makes the solution useful across PostgreSQL versions where additional background processes are present.

Conclusion

Monitoring PostgreSQL I/O per process provides another useful level of visibility for database performance analysis. With check_pg_process_io.sh and pg_process_io.py, Checkmk can show read and write throughput for individual PostgreSQL process roles. This makes troubleshooting high I/O activity much easier and helps answer a practical question:

Which PostgreSQL process is currently causing high I/O load?

For PostgreSQL administrators using Checkmk, this is a relatively small addition that can provide valuable insight when investigating database performance and storage activity.
0
Checkmk service monitoring

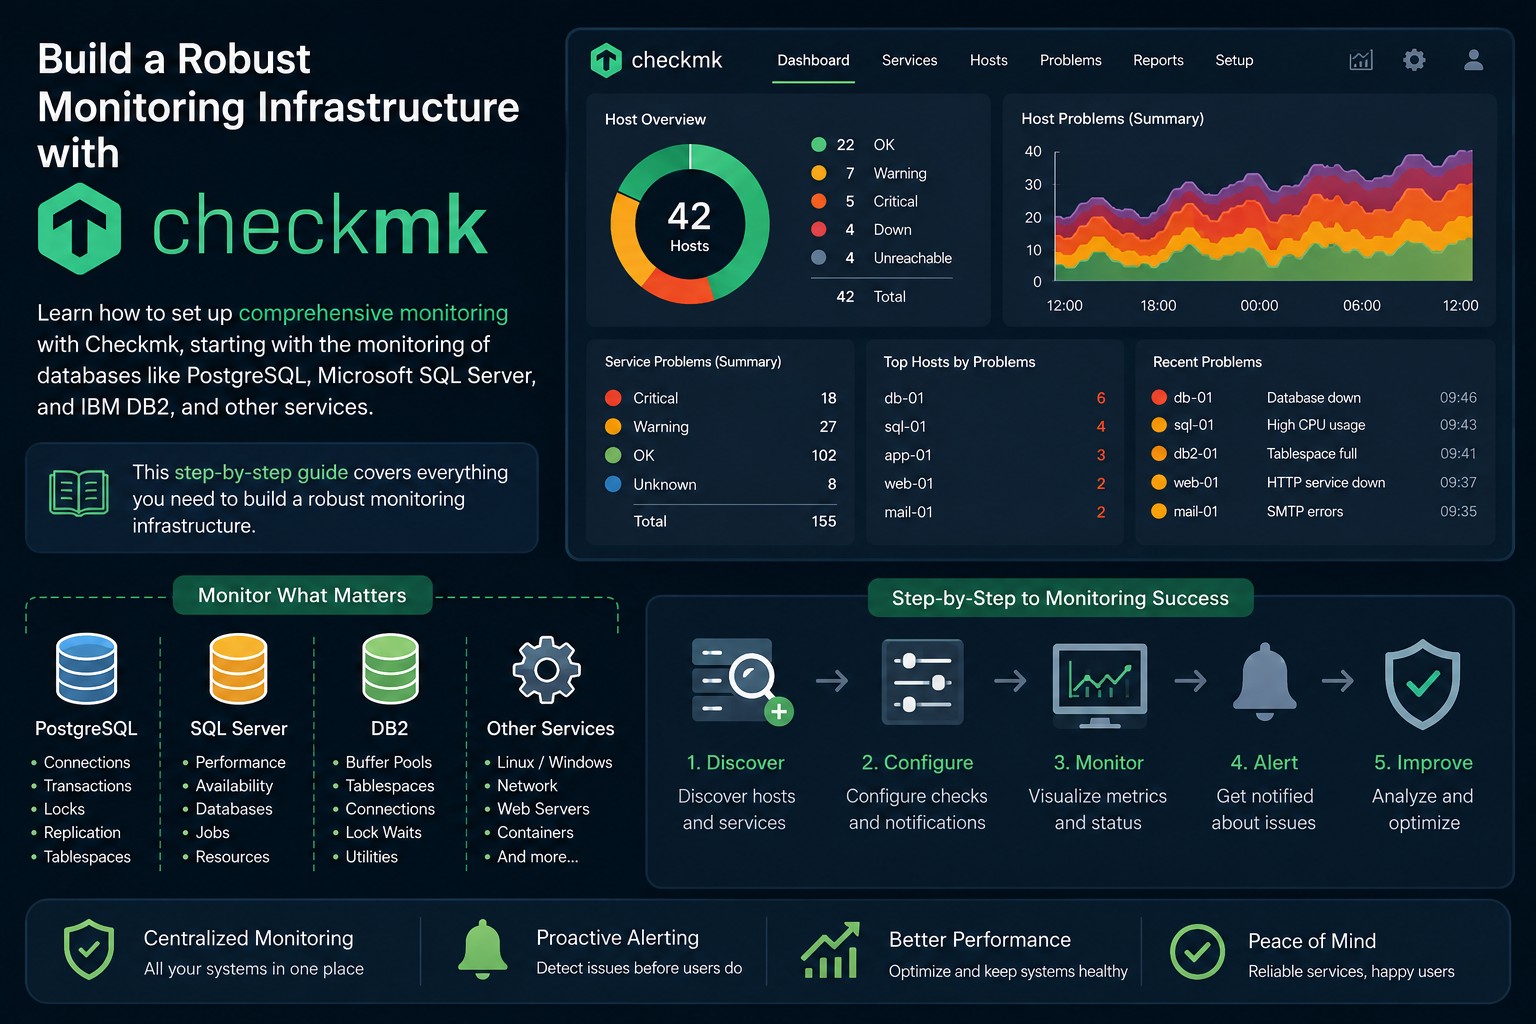
Checkmk Monitoring Guide: From Hosts to Databases and Custom Services


Learn how to set up comprehensive monitoring with Checkmk, starting with the monitoring of databases like PostgreSQL, Microsoft SQL Server, and IBM DB2, and other services. This step-by-step guide covers everything you need to build a robust monitoring infrastructure.


Why Use Checkmk for Comprehensive Monitoring?

Checkmk is a powerful, open-source monitoring solution that provides:
✅ End-to-end visibility across servers, applications, and databases
✅ Automatic service discovery to reduce manual configuration
✅ Performance metrics and historical data for trend analysis
✅ Flexible alerting with notifications via email, Slack, PagerDuty, and more
✅ Custom checks for monitoring any service or application
✅ Scalability from small environments to enterprise deployments

Whether you’re monitoring a single server or a complex infrastructure with hundreds of services, Checkmk provides the tools you need to stay on top of your systems.


Prerequisites

You should already have a running Checkmk server. The installation steps are described in this post (Step1).

Adding a Monitored Host to Checkmk

1.1 Install the Checkmk Agent on the Target Host

Linux (RHEL/CentOS/OL)

# run as root
# install the checkmk agent
wget lin3.fritz.box/mysite/check_mk/agents/check-mk-agent-2.5.0p10-1.noarch.rpm
dnf -y install ./check-mk-agent-2.5.0p10-1.noarch.rpm

Linux (Ubuntu/Debian)

# run as root
wget lin3.fritz.box/mysite/check_mk/agents/check-mk-agent_2.5.0p10-1_all.deb
apt -y install ./check-mk-agent_2.5.0p10-1_all.deb

Windows

Run the following in a command prompt to allow ICMP (ping) to the host:

netsh advfirewall firewall add rule name="ICMP Allow incoming V4 echo request" protocol=icmpv4:8,any dir=in action=allow

Then do the followoing:

  1. Download the agent from Setup > Agents > Windows in your Checkmk web interface
  2. Run the installer with administrator rights
  3. Configure the agent service to start automatically
  4. Verify the service is running in Services.msc

1.2 Add the host to Checkmk (GUI)

Navigate to the Checkmk GUI and add the new host:

  • Setup => Hosts => Add host (or click here)
  • Enter the Host name and click “Save & run service discovery”
  • Then Click “Accept all” to enable all discovered services
  • Click on Changes => Activate pending changes to perform the configuration changes

For the next step we need a agent registration password. Let’s create one in the GUI:

  • Go to Setup => Users => Edit the agent_registration user
  • Click on Create random secret and copy secret to clipboard and Save.
  • Activate the pending Changes: Changes => Activate pending Changes
  • The one time password is now saved to the clipboard (it is needed in the next step)

1.2 Configure TLS Encryption

Run this command on the monitored host to enable TLS:

On Linux:

# run as root
cmk-agent-ctl register --server lin3.fritz.box --site mysite --hostname lin6.fritz.box --user agent_registration --trust-cert
# enter the password from the previous step
Sample Output (click to expand):
[root@lin6 ~]# cmk-agent-ctl register --server lin3.fritz.box --site mysite --hostname lin6.fritz.box --user agent_registration --trust-cert

Password for Checkmk user 'agent_registration':
>
Registration complete.
[root@lin6 ~]#

On Windows

Run the following command in a command prompt and enter the registration password from the previous step:

C:\ProgramData\checkmk\agent\bin\cmk-agent-ctl.exe register --server lin3.fritz.box --site mysite --hostname win3.fritz.box --user agent_registration --trust-cert
Sample Output (click to expand):
C:\Windows\system32>C:\ProgramData\checkmk\agent\bin\cmk-agent-ctl.exe register --server lin3.fritz.box --site mysite --hostname win3.fritz.box --user agent_registration --trust-cert

Password for Checkmk user 'agent_registration':
>
Registration complete.

C:\Windows\system32>


Monitoring PostgreSQL Databases

The PostgreSQL database has been installed as documented in this post.

Install the PostgreSQL Plugin

On the Target Host (Linux)

# run as root
dnf -y install python3
wget -P /usr/lib/check_mk_agent/plugins lin3.fritz.box/mysite/check_mk/agents/plugins/mk_postgres.py
chmod +x /usr/lib/check_mk_agent/plugins/mk_postgres.py

Discover PostgreSQL Services in Checkmk

Perform the following steps to find the new PostgreSQL Checkmk services:

  • In the Host menu of the monitored host start: Run service discovery then Accept All
  • Activate the pending Changes: Changes => Activate pending Changes

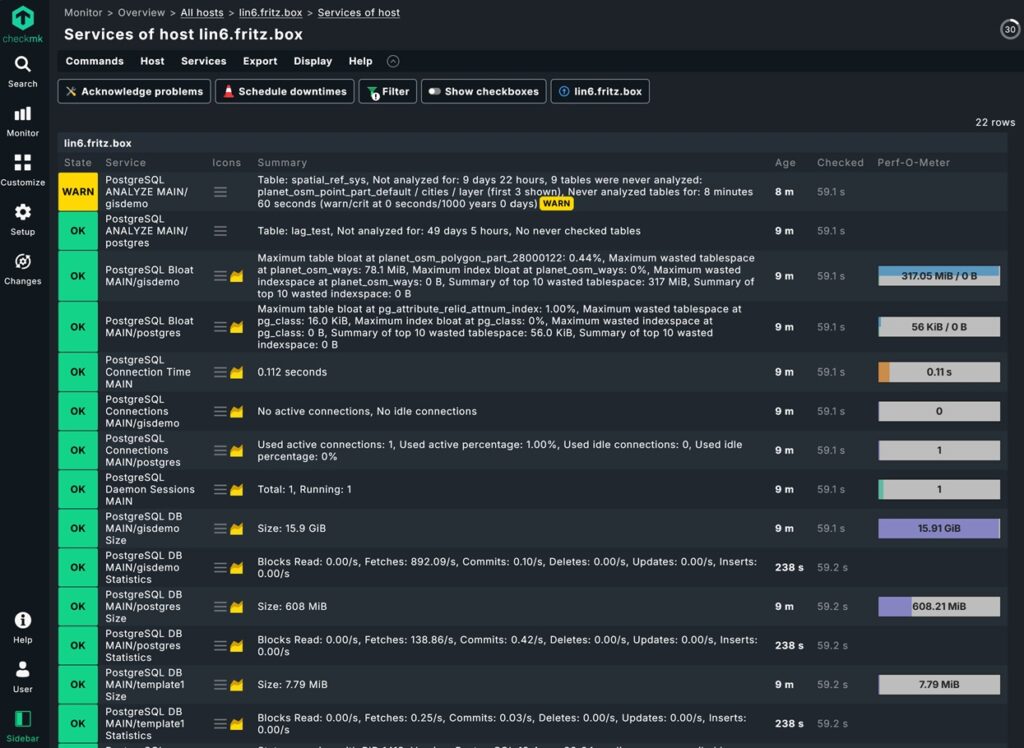
After these steps the PostgreSQL Services are discovered, and after some time they all have been checked:


Monitoring Microsoft SQL Server

The SQL Server has been installed as documented in this post.

Install the SQL Server Plugin

On the monitored host download the Checkmk SQL Server plugin from the Checkmk server to %ProgramData%\checkmk\agent\plugins . Next create the config file with the following content:

# run in PowerShell
$p="$env:ProgramData\checkmk\agent\config"; mkdir $p -Force; @"
---
mssql:
  main:
    authentication:
      username: ''
      type: integrated
"@ | Out-File "$p\mk-sql.yml" -Encoding utf8


Discover SQL Server Services in Checkmk

Perform the following steps to find the new SQL Server Checkmk services:

  • In the Host menu of the monitored host start: Run service discovery then Accept All
  • Activate the pending Changes: Changes => Activate pending Changes

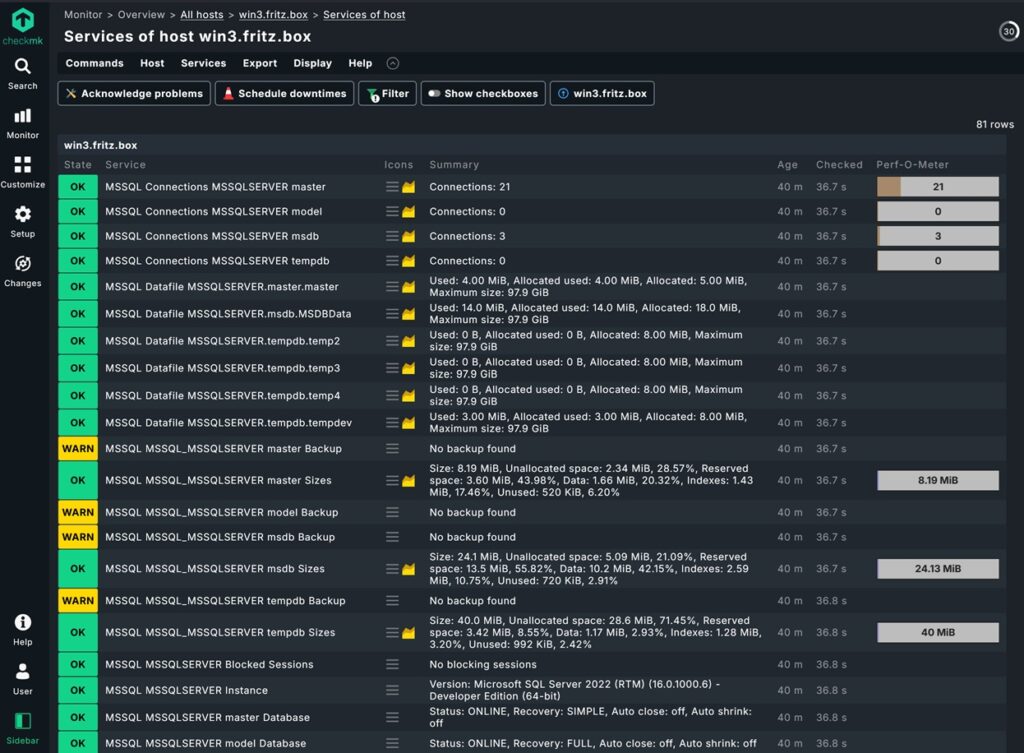
After these steps the SQL Server Services are discovered, and after some time they all have been checked:


Monitoring IBM DB2 databases

The IBM Db2 database server has been installed as documented in this post.

Install the DB2 Plugin

On the Target Host (Linux)

wget -P /usr/lib/check_mk_agent/plugins/ http://lin3.fritz.box/mysite/check_mk/agents/plugins/mk_db2.linux
chmod +x /usr/lib/check_mk_agent/plugins/mk_db2.linux

Discover Db2 Services in Checkmk

Perform the following steps to find the new Db2 Checkmk services:

  • In the Host menu of the monitored host start: Run service discovery then Accept All
  • Activate the pending Changes: Changes => Activate pending Changes

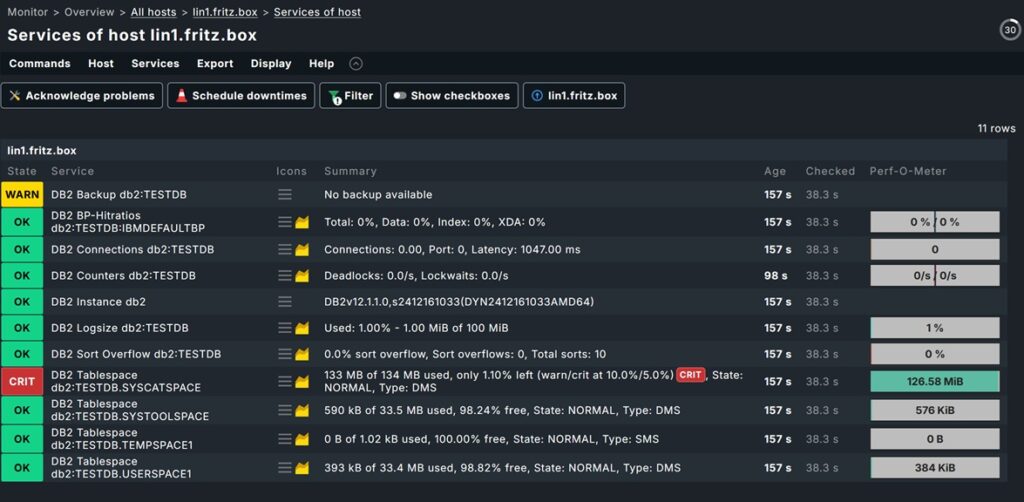
After these steps the Db2 Services are discovered, and after some time they all have been checked:


Monitoring Oracle Databases

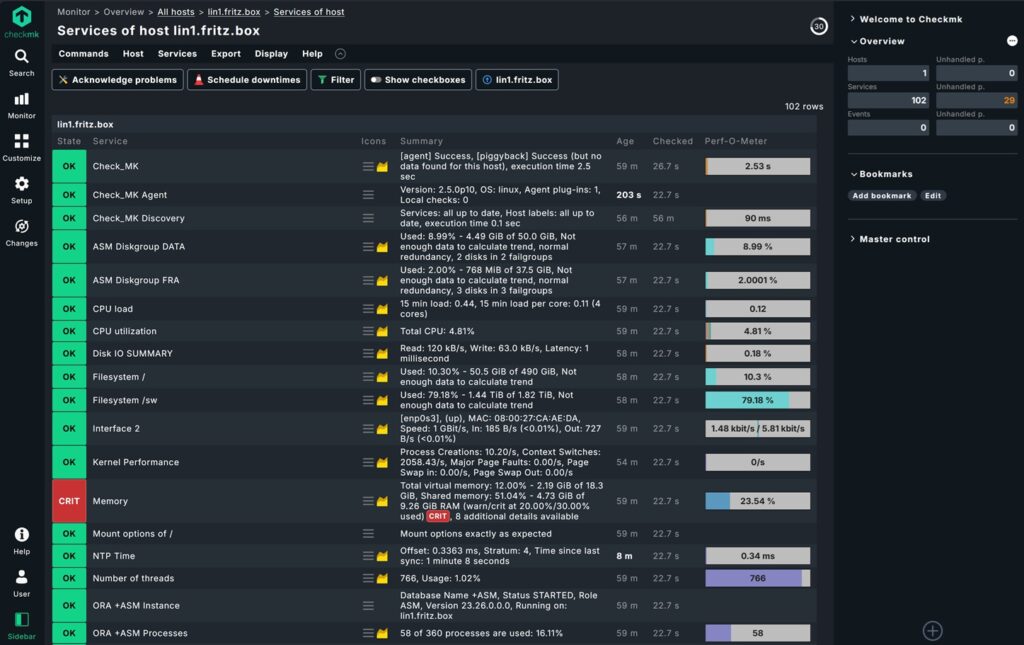
We already covered monitoring of Oracle databases with Checkmk in the post: Monitoring Oracle 26ai Database with Checkmk on Ubuntu 26.04. This post also covers the installation of the Checkmk server.


Conclusion

Setting up comprehensive monitoring with Checkmk gives you end-to-end visibility across your entire infrastructure. By following these steps, you can:

✅ Monitor hosts with secure TLS connections
✅ Track database performance for PostgreSQL, SQL Server, and DB2
✅ Get alerts before issues impact your users
✅ Analyze trends with historical data and dashboards

0

Monitoring Oracle 26ai Database with Checkmk on Ubuntu 26.04

Introduction

Monitoring databases is critical for ensuring performance, availability, and troubleshooting. Checkmk, an open-source monitoring tool, is a powerful choice for monitoring Oracle 26ai databases running on Linux. In this guide, we’ll walk through the process of setting up Checkmk Community Edition on Ubuntu 26.04 to monitor an Oracle 26ai database including ASM hosted on another system.

By the end of this post, you’ll have a fully functional Checkmk installation with copy-paste code snippets to get everything running smoothly.

Prerequisites

Before we begin, ensure you have the following:

  1. Ubuntu 26.04 Server VM: Installed and configured. You can follow this guide for a streamlined setup.
  2. Oracle 26ai Database with ASM: Running on a separate VM. Refer to this Oracle 26ai setup guide for installation instructions.
  3. SSH Access: Root or sudo access to both the Ubuntu 26.04 server and the Oracle 26ai VM.
  4. Network Connectivity: Ensure the Ubuntu server can communicate with the Oracle VM (e.g., via IP or hostname).

Step 1: Download and Install Checkmk Community Edition on the monitoring server

Download & Install Checkmk

Download the .deb package and install Checkmk Community Edition on the Ubuntu VM:

# run as root
wget https://download.checkmk.com/checkmk/2.5.0p10/check-mk-community-2.5.0p10_0.resolute_amd64.deb
apt -y install ./check-mk-community-2.5.0p10_0.resolute_amd64.deb
omd version
Sample Output (click to expand):
root@lin3:~# # run as root
wget https://download.checkmk.com/checkmk/2.5.0p10/check-mk-community-2.5.0p10_0.resolute_amd64.deb
apt install ./check-mk-community-2.5.0p10_0.resolute_amd64.deb
omd version
--2026-08-05 14:32:28--  https://download.checkmk.com/checkmk/2.5.0p10/check-mk-community-2.5.0p10_0.resolute_amd64.deb
Resolving download.checkmk.com (download.checkmk.com)... 45.133.11.29
Connecting to download.checkmk.com (download.checkmk.com)|45.133.11.29|:443... connected.
HTTP request sent, awaiting response... 200 OK
Length: 331054226 (316M) [application/vnd.debian.binary-package]
Saving to: ‘check-mk-community-2.5.0p10_0.resolute_amd64.deb’

check-mk-community-2.5.0p10_0 100%[==============================================>] 315.72M  10.7MB/s    in 31s

2026-08-05 14:32:59 (10.0 MB/s) - ‘check-mk-community-2.5.0p10_0.resolute_amd64.deb’ saved [331054226/331054226]

Note, selecting 'check-mk-community-2.5.0p10' instead of './check-mk-community-2.5.0p10_0.resolute_amd64.deb'
The following packages were automatically installed and are no longer required:
  linux-image-7.0.0-27-generic             linux-modules-7.0.0-27-generic  linux-tools-7.0.0-27-generic
  linux-main-modules-zfs-7.0.0-27-generic  linux-tools-7.0.0-27
Use 'apt autoremove' to remove them.

Installing:
  check-mk-community-2.5.0p10

Installing dependencies:
  apache2            libaprutil1-dbd-sqlite3  libfsverity0        librpmio10    php8.5-cgi       rpcbind
  apache2-bin        libaprutil1-ldap         libgvc7             librpmsign10  php8.5-cli       rpm
  apache2-data       libaprutil1t64           libgvplugin-gd8     libsodium23   php8.5-common    rpm-common
  apache2-utils      libargon2-1              libgvplugin-pango8  libxdot4      php8.5-gd        rpm2cpio
  debugedit          libcdt6                  libgvpr2            php-cgi       php8.5-readline  samba-common
  dialog             libcgraph8               liblua5.3-0         php-cli       php8.5-sqlite3   samba-common-bin
  freeradius-common  libdbi-perl              libpathplan4        php-common    php8.5-xml       smbclient
  freeradius-config  libdialog15              libpq5              php-gd        python3-ldb      tdb-tools
  freeradius-utils   libevent-2.1-7t64        librpm-sequoia-1    php-pear      python3-samba    traceroute
  graphviz           libfl2                   librpm10            php-sqlite3   python3-talloc   xinetd
  libapr1t64         libfreeradius3           librpmbuild10       php-xml       python3-tdb

Suggested packages:
  apache2-doc              gsfonts        libnet-daemon-perl     alien     heimdal-clients
  apache2-suexec-pristine  graphviz-doc   libsql-statement-perl  elfutils  cifs-utils
  | apache2-suexec-custom  libmldbm-perl  libpq-oauth            rpmlint

Summary:
  Upgrading: 0, Installing: 66, Removing: 0, Not Upgrading: 0
  Download size: 23.2 MB / 354 MB
  Space needed: 102 MB / 83.0 GB available

Continue? [Y/n]
...
Processing triggers for ufw (0.36.2-9build1)…
Processing triggers for man-db (2.13.1-1build1)…
Processing triggers for dbus (1.16.2-2ubuntu4)…
Processing triggers for libc-bin (2.43-2ubuntu2.3)…
Processing triggers for php8.5-cli (8.5.4-0ubuntu1.2)…
Processing triggers for php8.5-cgi (8.5.4-0ubuntu1.2)…
Notice: Download is performed unsandboxed as root as file '/root/check-mk-community-2.5.0p10_0.resolute_amd64.deb' couldn't be accessed by user '_apt'. - pkgAcquire::Run (13: Permission denied)
OMD - Open Monitoring Distribution Version 2.5.0p10.community
root@lin3:~#

Initialize the Checkmk Site

Create a new Checkmk site (replace mysite with your preferred site name):

# run as root
omd create mysite
# start the site
omd start mysite
Sample Output (click to expand):
root@lin3:~# # run as root
omd create mysite
# start the site
omd start mysite
Adding /opt/omd/sites/mysite/tmp to /etc/fstab.
Creating temporary filesystem /omd/sites/mysite/tmp...OK
Executing post-create script "01_create-sample-config.py"...OK
Executing post-create script "02_message-broker-certs"...OK
Updating core configuration...
Generating configuration for core (type nagios)...
Precompiling host checks...OK
Restarting Apache...OK
Created new site mysite with version 2.5.0p10.community.

  The site can be started with omd start mysite.
  The default web UI is available at http://lin3.fritz.box/mysite/

  The admin user for the web applications is cmkadmin with password: xxx
  For command line administration of the site, log in with 'omd su mysite'.
  After logging in, you can change the password for cmkadmin with 'cmk-passwd cmkadmin'.

Starting agent-receiver...OK
Starting mkeventd...OK
Starting rrdcached...OK
Starting redis...OK
Starting npcd...OK
Starting automation-helper...OK
Starting ui-job-scheduler...OK
Starting nagios...OK
Starting apache...OK
Starting crontab...OK
root@lin3:~#

Access the Checkmk web interface by navigating to a URL similar to:

http://lin3.fritz.box/mysite/

Log in with the default credentials:

  • Username: cmkadmin
  • Password: as shown in the previous step

The password can be changed now (User => Change password)

Step 2: Configure Checkmk for Oracle 26ai Monitoring

Install Oracle Monitoring Agent and the mk_oracle plugin

Checkmk uses the MKS (Checkmk Agent Plugins) to monitor Oracle databases. Install the agent and the agent plugin:

On the Oracle 26ai VM:

# run as root
# install the checkmk agent
wget lin3.fritz.box/mysite/check_mk/agents/check-mk-agent-2.5.0p10-1.noarch.rpm
dnf -y install ./check-mk-agent-2.5.0p10-1.noarch.rpm

# create monitoring users on the ASM and CDB
su - grid -c '
sqlplus -S / as sysasm <<EOF
create user cmk_asm identified by changeme;
grant sysdba to cmk_asm;
EXIT;
EOF
'
su - oracle -c '
sql -S / as sysdba <<EOF
create user c##checkmk identified by changeme;
alter user c##checkmk set container_data=all container=current;
grant select_catalog_role to c##checkmk container=all;
grant create session to c##checkmk container=all;
EXIT;
EOF
'

# create the Oracle Wallet to store the CDB password
echo -e 'mysecret1\nmysecret1'|/u01/app/oracle/product/23.26.0/dbhome_1/bin/mkstore -wrl /etc/check_mk/oracle_wallet -create
echo mysecret1|/u01/app/oracle/product/23.26.0/dbhome_1/bin/mkstore -wrl /etc/check_mk/oracle_wallet -createCredential orcl c\#\#checkmk changeme
chgrp -R oinstall /etc/check_mk/oracle_wallet
chmod g+x /etc/check_mk/oracle_wallet
chmod -R g+r /etc/check_mk/oracle_wallet

# create checkmk config files (sqlnet.ora, tnsnames.ora and mk_oracle.cfg
cat > /etc/check_mk/sqlnet.ora <<EOF
LOG_DIRECTORY_CLIENT = /var/log/check_mk/oracle_client
DIAG_ADR_ENABLED = OFF

SQLNET.WALLET_OVERRIDE = TRUE
WALLET_LOCATION =
 (SOURCE=
   (METHOD = FILE)
   (METHOD_DATA = (DIRECTORY=/etc/check_mk/oracle_wallet))
 )
EOF
mkdir -p /var/log/check_mk/oracle_client
chown -R oracle:oinstall /var/log/check_mk
cat > /etc/check_mk/tnsnames.ora <<EOF
+ASM =
  (DESCRIPTION =
    (ADDRESS = (PROTOCOL = TCP)(HOST = 127.0.0.1)(PORT = 1521))
    (CONNECT_DATA =
      (SERVER = DEDICATED)
      (SERVICE_NAME = +ASM)
    )
  )

orcl =
  (DESCRIPTION =
    (ADDRESS = (PROTOCOL = TCP)(HOST = 127.0.0.1)(PORT = 1521))
    (CONNECT_DATA =
      (SERVER = DEDICATED)
      (SERVICE_NAME = orcl.fritz.box)
    )
  )
EOF
cat >/etc/check_mk/mk_oracle.cfg <<EOF
DBUSER='/:'
ASMUSER='cmk_asm:changeme:SYSDBA'
EOF
# adjust permissions
chgrp oinstall /etc/check_mk/sqlnet.ora /etc/check_mk/tnsnames.ora

# install the checkmk oracle agent plugin
mkdir /usr/lib/check_mk_agent/plugins/60
wget -P /usr/lib/check_mk_agent/plugins/60 lin3.fritz.box/mysite/check_mk/agents/plugins/mk_oracle
chmod +x /usr/lib/check_mk_agent/plugins/60/mk_oracle
Sample Output (click to expand):
[root@lin1 ~]# # run as root
[root@lin1 ~]# # install the checkmk agent
[root@lin1 ~]# wget lin3.fritz.box/mysite/check_mk/agents/check-mk-agent-2.5.0p10-1.noarch.rpm
--2026-08-05 15:35:27--  http://lin3.fritz.box/mysite/check_mk/agents/check-mk-agent-2.5.0p10-1.noarch.rpm
Resolving lin3.fritz.box (lin3.fritz.box)... 11.1.1.177
Connecting to lin3.fritz.box (lin3.fritz.box)|11.1.1.177|:80... connected.
HTTP request sent, awaiting response... 200 OK
Length: 5765323 (5.5M) [application/x-redhat-package-manager]
Saving to: ‘check-mk-agent-2.5.0p10-1.noarch.rpm’

check-mk-agent-2.5.0p10-1.noarch.r 100%[=============================================================>]   5.50M  --.-KB/s    in 0.05s

2026-08-05 15:35:27 (113 MB/s) - ‘check-mk-agent-2.5.0p10-1.noarch.rpm’ saved [5765323/5765323]

[root@lin1 ~]# dnf -y install ./check-mk-agent-2.5.0p10-1.noarch.rpm
Last metadata expiration check: 1 day, 4:18:07 ago on Tue 04 Aug 2026 11:17:24 AM CEST.
Dependencies resolved.
=========================================================================================================================================
 Package                             Architecture                Version                         Repository                         Size
=========================================================================================================================================
Installing:
 check-mk-agent                      noarch                      2.5.0p10-1                      @commandline                      5.5 M

Transaction Summary
=========================================================================================================================================
Install  1 Package

Total size: 5.5 M
Installed size: 5.5 M
Downloading Packages:
Running transaction check
Transaction check succeeded.
Running transaction test
Transaction test succeeded.
Running transaction
  Preparing        :                                                                                                                 1/1
  Running scriptlet: check-mk-agent-2.5.0p10-1.noarch                                                                                1/1
  Installing       : check-mk-agent-2.5.0p10-1.noarch                                                                                1/1
  Running scriptlet: check-mk-agent-2.5.0p10-1.noarch                                                                                1/1

Deploying agent controller: /usr/bin/cmk-agent-ctl
Deploying systemd units: cmk-agent-ctl-daemon.service check-mk-agent-async.service check-mk-agent@.service check-mk-agent.socket
Deployed systemd
Creating/updating 'cmk-agent' user account ...

WARNING: The agent controller is operating in an insecure mode! To secure the connection run `cmk-agent-ctl register`.

Activating systemd unit 'cmk-agent-ctl-daemon.service'...
Created symlink /etc/systemd/system/multi-user.target.wants/cmk-agent-ctl-daemon.service → /usr/lib/systemd/system/cmk-agent-ctl-daemon.service.
Activating systemd unit 'check-mk-agent-async.service'...
Created symlink /etc/systemd/system/multi-user.target.wants/check-mk-agent-async.service → /usr/lib/systemd/system/check-mk-agent-async.service.
Activating systemd unit 'check-mk-agent.socket'...
Created symlink /etc/systemd/system/sockets.target.wants/check-mk-agent.socket → /usr/lib/systemd/system/check-mk-agent.socket.

  Verifying        : check-mk-agent-2.5.0p10-1.noarch                                                                                1/1

Installed:
  check-mk-agent-2.5.0p10-1.noarch

Complete!
[root@lin1 ~]#
[root@lin1 ~]# # create monitoring users on the ASM and CDB
[root@lin1 ~]# su - grid -c '
> sqlplus -S / as sysasm <<EOF
> create user cmk_asm identified by changeme;
> grant sysdba to cmk_asm;
> EXIT;
> EOF
> '

User created.


Grant succeeded.

[root@lin1 ~]# su - oracle -c '
> sql -S / as sysdba <<EOF
> create user c##checkmk identified by changeme;
> alter user c##checkmk set container_data=all container=current;
> grant select_catalog_role to c##checkmk container=all;
> grant create session to c##checkmk container=all;
> EXIT;
> EOF
> '


User C##CHECKMK created.


User C##CHECKMK altered.


Grant succeeded.


Grant succeeded.

[root@lin1 ~]#
[root@lin1 ~]# # create the Oracle Wallet to store the CDB password
[root@lin1 ~]# echo -e 'mysecret1\nmysecret1'|/u01/app/oracle/product/23.26.0/dbhome_1/bin/mkstore -wrl /etc/check_mk/oracle_wallet -create
Oracle Secret Store Tool Release 23.0.0.0.0 - Production
Version 23.0.0.0.0
Copyright (c) 2004, 2025, Oracle and/or its affiliates. All rights reserved.

Enter password:
Enter password again:
[root@lin1 ~]# echo mysecret1|/u01/app/oracle/product/23.26.0/dbhome_1/bin/mkstore -wrl /etc/check_mk/oracle_wallet -createCredential orcl c\#\#checkmk changeme
Oracle Secret Store Tool Release 23.0.0.0.0 - Production
Version 23.0.0.0.0
Copyright (c) 2004, 2025, Oracle and/or its affiliates. All rights reserved.

Enter wallet password:
[root@lin1 ~]# chgrp -R oinstall /etc/check_mk/oracle_wallet
[root@lin1 ~]# chmod g+x /etc/check_mk/oracle_wallet
[root@lin1 ~]# chmod -R g+r /etc/check_mk/oracle_wallet
[root@lin1 ~]#
[root@lin1 ~]# # create checkmk config files (sqlnet.ora, tnsnames.ora and mk_oracle.cfg
[root@lin1 ~]# cat > /etc/check_mk/sqlnet.ora <<EOF
> LOG_DIRECTORY_CLIENT = /var/log/check_mk/oracle_client
> DIAG_ADR_ENABLED = OFF
>
> SQLNET.WALLET_OVERRIDE = TRUE
> WALLET_LOCATION =
>  (SOURCE=
>    (METHOD = FILE)
>    (METHOD_DATA = (DIRECTORY=/etc/check_mk/oracle_wallet))
>  )
> EOF
[root@lin1 ~]# mkdir -p /var/log/check_mk/oracle_client
[root@lin1 ~]# chown -R oracle:oinstall /var/log/check_mk
[root@lin1 ~]# cat > /etc/check_mk/tnsnames.ora <<EOF
> +ASM =
>   (DESCRIPTION =
>     (ADDRESS = (PROTOCOL = TCP)(HOST = 127.0.0.1)(PORT = 1521))
>     (CONNECT_DATA =
>       (SERVER = DEDICATED)
>       (SERVICE_NAME = +ASM)
>     )
>   )
>
> orcl =
>   (DESCRIPTION =
>     (ADDRESS = (PROTOCOL = TCP)(HOST = 127.0.0.1)(PORT = 1521))
>     (CONNECT_DATA =
>       (SERVER = DEDICATED)
>       (SERVICE_NAME = orcl.fritz.box)
>     )
>   )
> EOF
[root@lin1 ~]# cat >/etc/check_mk/mk_oracle.cfg <<EOF
> DBUSER='/:'
> ASMUSER='cmk_asm:changeme:SYSDBA'
> EOF
[root@lin1 ~]# # adjust permissions
[root@lin1 ~]# chgrp oinstall /etc/check_mk/sqlnet.ora /etc/check_mk/tnsnames.ora
[root@lin1 ~]#
[root@lin1 ~]# # install the checkmk oracle agent plugin
[root@lin1 ~]# mkdir /usr/lib/check_mk_agent/plugins/60
[root@lin1 ~]# wget -P /usr/lib/check_mk_agent/plugins/60 lin3.fritz.box/mysite/check_mk/agents/plugins/mk_oracle
--2026-08-05 15:35:52--  http://lin3.fritz.box/mysite/check_mk/agents/plugins/mk_oracle
Resolving lin3.fritz.box (lin3.fritz.box)... 11.1.1.177
Connecting to lin3.fritz.box (lin3.fritz.box)|11.1.1.177|:80... connected.
HTTP request sent, awaiting response... 200 OK
Length: 145178 (142K) [text/plain]
Saving to: ‘/usr/lib/check_mk_agent/plugins/60/mk_oracle’

mk_oracle                          100%[=============================================================>] 141.78K  --.-KB/s    in 0.001s

2026-08-05 15:35:52 (131 MB/s) - ‘/usr/lib/check_mk_agent/plugins/60/mk_oracle’ saved [145178/145178]

[root@lin1 ~]# chmod +x /usr/lib/check_mk_agent/plugins/60/mk_oracle
[root@lin1 ~]#

On the Checkmk Server:

  1. Add the Oracle VM as a Host:
    • Log in to the Checkmk web interface.
    • Navigate to Setup > Hosts > Add host.
    • Enter the IP address or hostname of the Oracle VM.
    • Click Save & run Service Discovery.
  2. Enable Oracle Checks:
    • On the Service Discovery Page select: Accept All
    • Then go to Changes > Activate Pending Changes
  3. Secure Agent Communication:
    • Create a registration password in the GUI (Setup>Users>Edit agent_registration>Create random secret > save)
    • on the Oracle host run: cmk-agent-ctl register --server lin3.fritz.box --site mysite --hostname lin1.fritz.box --user agent_registration --trust-cert (and enter the password from the clipboard)

Step 3: Verify Oracle 26ai Monitoring

  1. Check Host Status:
    • Navigate to Monitor > All hosts in the Checkmk web interface.
    • Select your Oracle VM host. You should see services related to Oracle (e.g., Oracle Tablespaces, Oracle Performance).

Troubleshooting

The following commands can be used to test the connection from mk_oracle to the databases:

# run as root ion the database server
export MK_CONFDIR="/etc/check_mk/"; export MK_VARDIR="/var/lib/check_mk_agent/"
/usr/lib/check_mk_agent/plugins/60/mk_oracle -t --no-spool
Sample Failure Output (click to expand):
[root@lin1 ~]# /usr/lib/check_mk_agent/plugins/60/mk_oracle -t --no-spool
<<<oracle_instance>>>
<<<oracle_sessions>>>
<<<oracle_logswitches>>>
<<<oracle_undostat>>>
<<<oracle_recovery_area>>>
<<<oracle_processes>>>
<<<oracle_recovery_status>>>
<<<oracle_longactivesessions>>>
<<<oracle_dataguard_stats>>>
<<<oracle_performance>>>
<<<oracle_locks>>>
<<<oracle_systemparameter>>>
<<<oracle_tablespaces>>>
<<<oracle_rman>>>
<<<oracle_jobs>>>
<<<oracle_resumable>>>
<<<oracle_iostats>>>
<<<oracle_instance>>>
<<<oracle_processes>>>
<<<oracle_asm_diskgroup>>>
    Logindetails:           /@orcl

---checking permissions-------------------------------------------------
see https://checkmk.atlassian.net/wiki/spaces/KB/pages/70582273/Troubleshooting+mk+oracle+for+Windows+and+Linux

* sqlplus binary: /u01/app/oracle/product/23.26.0/dbhome_1/bin/sqlplus
* sqlplus binary owner: oracle
* change user: true
* $TNS_ADMIN: /etc/check_mk/
* user "oracle" can read /etc/check_mk//sqlnet.ora
* user "oracle" can read /etc/check_mk//tnsnames.ora

* test-login does not work!

  Could not login. In case you are using a wallet to connect, there might be a permission error.
  Make sure that the wallet folder can be read and executed by user "oracle" and
  the files inside the wallet can be read by the user.
  Consult your ora files for hints where the wallet is located:
  /etc/check_mk//sqlnet.ora
  /etc/check_mk//tnsnames.ora

------------------------------------------------------------------------

---login----------------------------------------------------------------
    Operating System:       Linux
    ORACLE_HOME (GI):       /u01/app/oracle/product/23.26.0/dbhome_1
    Logincheck to Instance: orcl
    Version:
    Error Message:          ORCL|FAILURE|ERROR: ORA-01017: invalid credential or not authorized; logon denied Help: https://docs
    SYNC_SECTIONS:          instance sessions logswitches undostat recovery_area processes recovery_status longactivesessions dataguard_stats performance locks systemparameter
    ASYNC_SECTIONS:         tablespaces rman jobs resumable iostats
------------------------------------------------------------------------

[root@lin1 ~]#
Sample Output Success (click to expand):
[root@lin1 ~]# export MK_CONFDIR="/etc/check_mk/"; export MK_VARDIR="/var/lib/check_mk_agent/"
[root@lin1 ~]# /usr/lib/check_mk_agent/plugins/60/mk_oracle -t --no-spool
<<<oracle_instance>>>
<<<oracle_sessions>>>
<<<oracle_logswitches>>>
<<<oracle_undostat>>>
<<<oracle_recovery_area>>>
<<<oracle_processes>>>
<<<oracle_recovery_status>>>
<<<oracle_longactivesessions>>>
<<<oracle_dataguard_stats>>>
<<<oracle_performance>>>
<<<oracle_locks>>>
<<<oracle_systemparameter>>>
<<<oracle_tablespaces>>>
<<<oracle_rman>>>
<<<oracle_jobs>>>
<<<oracle_resumable>>>
<<<oracle_iostats>>>
<<<oracle_instance>>>
<<<oracle_processes>>>
<<<oracle_asm_diskgroup>>>

---checking permissions-------------------------------------------------
see https://checkmk.atlassian.net/wiki/spaces/KB/pages/70582273/Troubleshooting+mk+oracle+for+Windows+and+Linux

* sqlplus binary: /u01/app/23.26.0/grid/bin/sqlplus
* sqlplus binary owner: grid
* change user: true
* $TNS_ADMIN: /etc/check_mk/
* user "grid" can read /etc/check_mk//sqlnet.ora
* user "grid" can read /etc/check_mk//tnsnames.ora

* test login works
------------------------------------------------------------------------

---login----------------------------------------------------------------
    Operating System:       Linux
    ORACLE_HOME (GI):       /u01/app/23.26.0/grid
    Logincheck to Instance: +ASM
    Version:
    Login ok User:          SYS on lin1.fritz.box Instance +ASM
    SYNC_SECTIONS:          instance processes
    ASYNC_SECTIONS:         asm_diskgroup
------------------------------------------------------------------------


---checking permissions-------------------------------------------------
see https://checkmk.atlassian.net/wiki/spaces/KB/pages/70582273/Troubleshooting+mk+oracle+for+Windows+and+Linux

* sqlplus binary: /u01/app/oracle/product/23.26.0/dbhome_1/bin/sqlplus
* sqlplus binary owner: oracle
* change user: true
* $TNS_ADMIN: /etc/check_mk/
* user "oracle" can read /etc/check_mk//sqlnet.ora
* user "oracle" can read /etc/check_mk//tnsnames.ora

* test login works
------------------------------------------------------------------------

---login----------------------------------------------------------------
    Operating System:       Linux
    ORACLE_HOME (GI):       /u01/app/oracle/product/23.26.0/dbhome_1
    Logincheck to Instance: orcl
    Version:
    Login ok User:          C##CHECKMK on lin1.fritz.box Instance orcl
    SYNC_SECTIONS:          instance sessions logswitches undostat recovery_area processes recovery_status longactivesessions dataguard_stats performance locks systemparameter
    ASYNC_SECTIONS:         tablespaces rman jobs resumable iostats
------------------------------------------------------------------------

[root@lin1 ~]#

Useful resources

Conclusion

You’ve now successfully set up Checkmk Community Edition on Ubuntu 26.04 to monitor an Oracle 26ai database running on a separate VM. This setup ensures you can track database performance, storage, and availability in real time.

Next Steps:

  • Explore Checkmk’s dashboards and alerting rules to customize your monitoring.
  • Set up notifications (e.g., email or Slack) for critical alerts.
  • Consider integrating Checkmk with other tools like Grafana for advanced visualization.

Call to Action:
Have you tried monitoring Oracle 26ai with Checkmk? Share your experiences or questions in the comments below!

0