This Db2 Cheat Sheet provides a compact overview of commonly used SQL statements, functions and administration commands for developers and DBAs. Whether for quick lookup, troubleshooting or learning purposes, this reference guide is designed to make working with Db2 faster and more efficient.
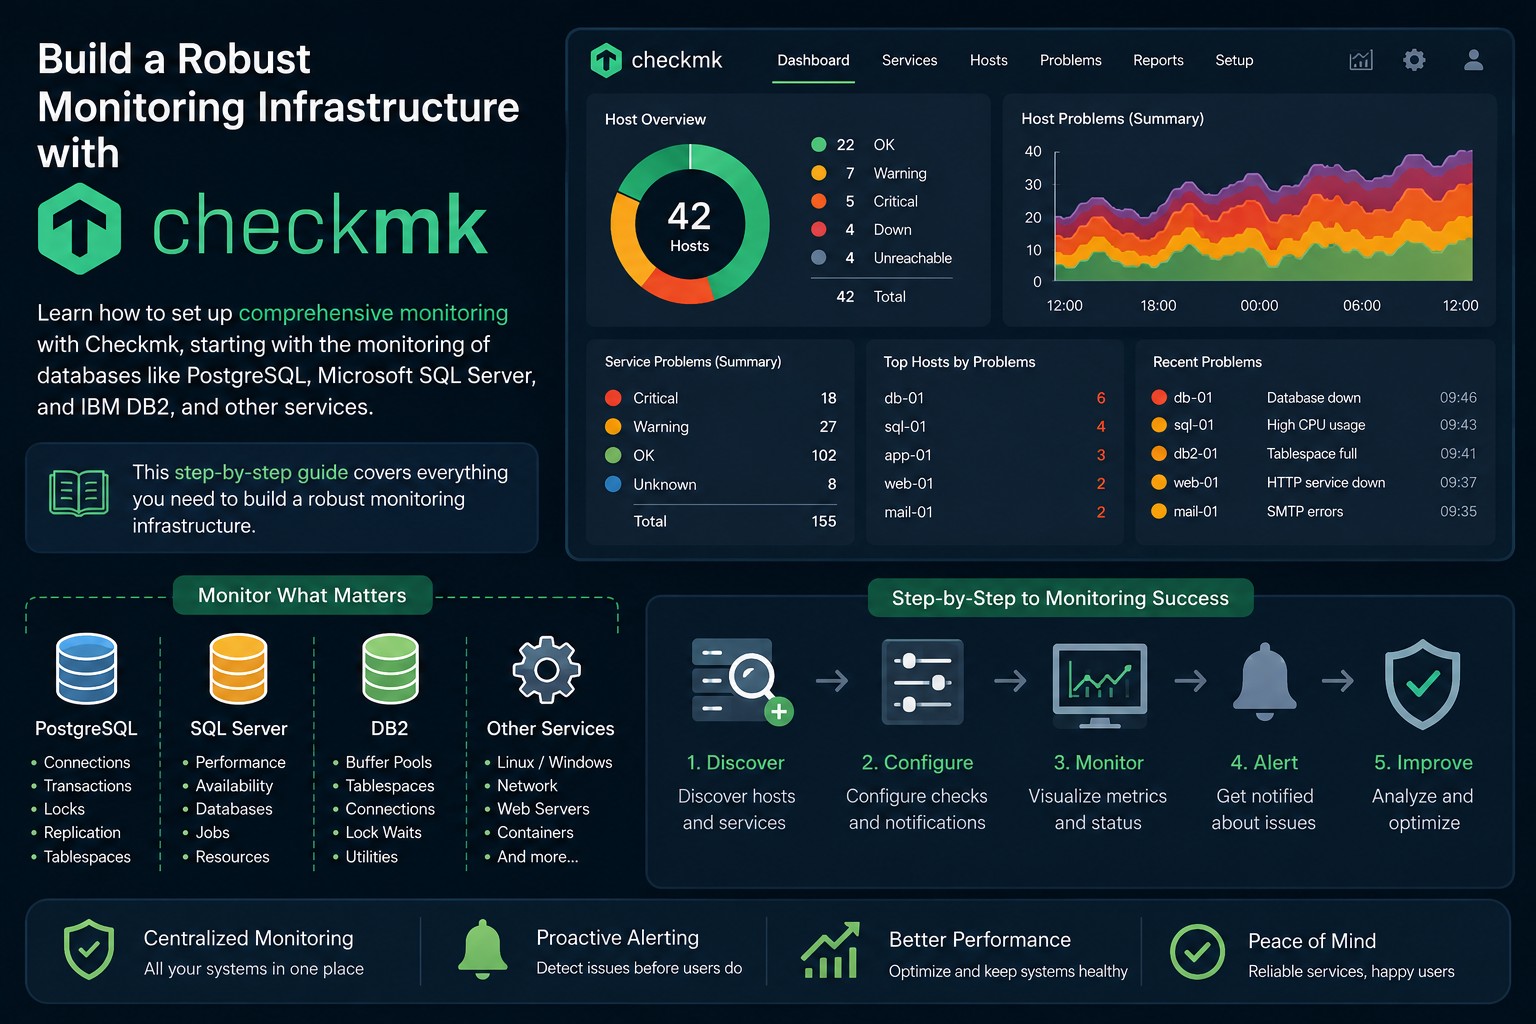
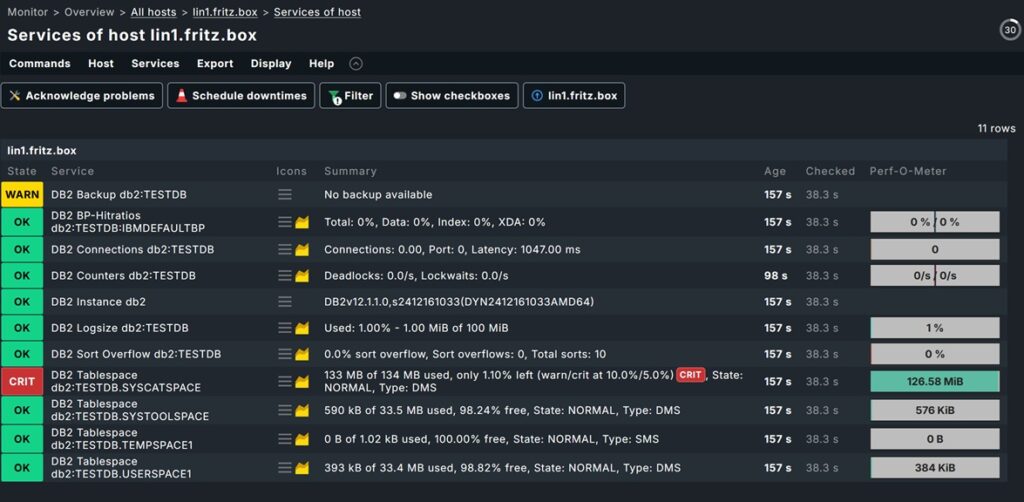
Learn how to set up comprehensive monitoring with Checkmk, starting with the monitoring of databases like PostgreSQL, Microsoft SQL Server, and IBM DB2, and other services. This step-by-step guide covers everything you need to build a robust monitoring infrastructure.
Checkmk is a powerful, open-source monitoring solution that provides: ✅ End-to-end visibility across servers, applications, and databases ✅ Automatic service discovery to reduce manual configuration ✅ Performance metrics and historical data for trend analysis ✅ Flexible alerting with notifications via email, Slack, PagerDuty, and more ✅ Custom checks for monitoring any service or application ✅ Scalability from small environments to enterprise deployments
Whether you’re monitoring a single server or a complex infrastructure with hundreds of services, Checkmk provides the tools you need to stay on top of your systems.
Prerequisites
You should already have a running Checkmk server. The installation steps are described in this post (Step1).
Adding a Monitored Host to Checkmk
1.1 Install the Checkmk Agent on the Target Host
Linux (RHEL/CentOS/OL)
# run as root
# install the checkmk agent
wget lin3.fritz.box/mysite/check_mk/agents/check-mk-agent-2.5.0p10-1.noarch.rpm
dnf -y install ./check-mk-agent-2.5.0p10-1.noarch.rpm
Linux (Ubuntu/Debian)
# run as root
wget lin3.fritz.box/mysite/check_mk/agents/check-mk-agent_2.5.0p10-1_all.deb
apt -y install ./check-mk-agent_2.5.0p10-1_all.deb
Windows
Run the following in a command prompt to allow ICMP (ping) to the host:
Enter the Host name and click “Save & run service discovery”
Then Click “Accept all” to enable all discovered services
Click on Changes => Activate pending changes to perform the configuration changes
For the next step we need a agent registration password. Let’s create one in the GUI:
Go to Setup => Users => Edit the agent_registration user
Click on Create random secret and copy secret to clipboard and Save.
Activate the pending Changes: Changes => Activate pending Changes
The one time password is now saved to the clipboard (it is needed in the next step)
1.2 Configure TLS Encryption
Run this command on the monitored host to enable TLS:
On Linux:
# run as root
cmk-agent-ctl register --server lin3.fritz.box --site mysite --hostname lin6.fritz.box --user agent_registration --trust-cert
# enter the password from the previous step
C:\Windows\system32>C:\ProgramData\checkmk\agent\bin\cmk-agent-ctl.exe register --server lin3.fritz.box --site mysite --hostname win3.fritz.box --user agent_registration --trust-cert

Password for Checkmk user 'agent_registration':
>
Registration complete.

C:\Windows\system32>
Monitoring PostgreSQL Databases
The PostgreSQL database has been installed as documented in this post.
Install the PostgreSQL Plugin
On the Target Host (Linux)
# run as root
dnf -y install python3
wget -P /usr/lib/check_mk_agent/plugins lin3.fritz.box/mysite/check_mk/agents/plugins/mk_postgres.py
chmod +x /usr/lib/check_mk_agent/plugins/mk_postgres.py
Discover PostgreSQL Services in Checkmk
Perform the following steps to find the new PostgreSQL Checkmk services:
In the Host menu of the monitored host start: Run service discovery then Accept All
Activate the pending Changes: Changes => Activate pending Changes
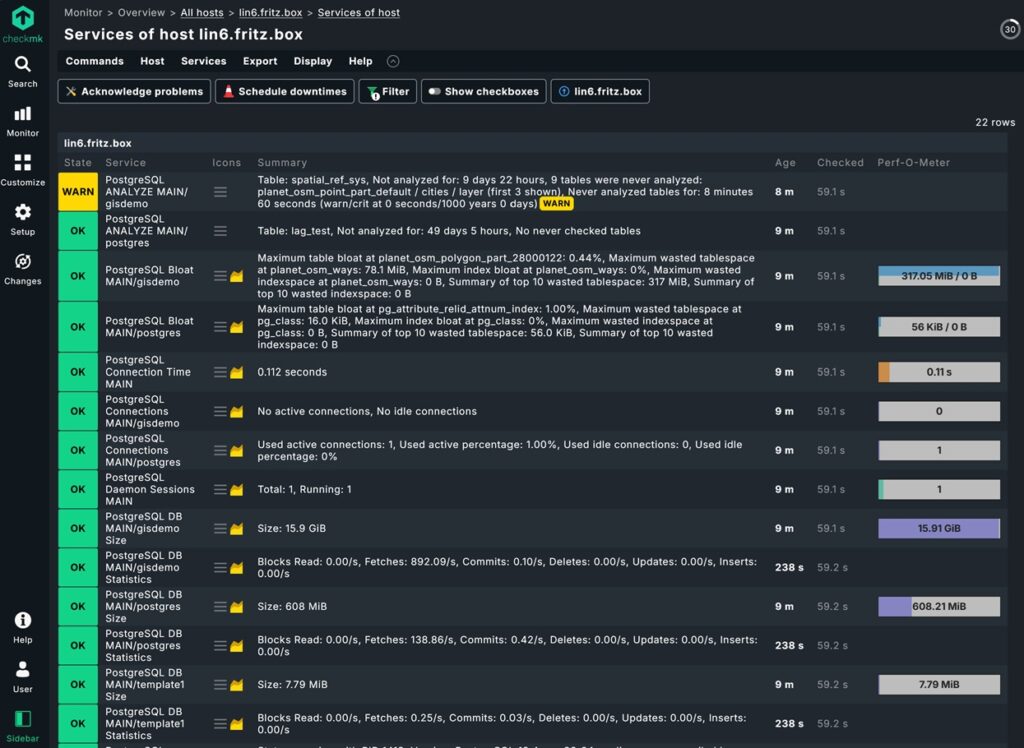
After these steps the PostgreSQL Services are discovered, and after some time they all have been checked:
Monitoring Microsoft SQL Server
The SQL Server has been installed as documented in this post.
Install the SQL Server Plugin
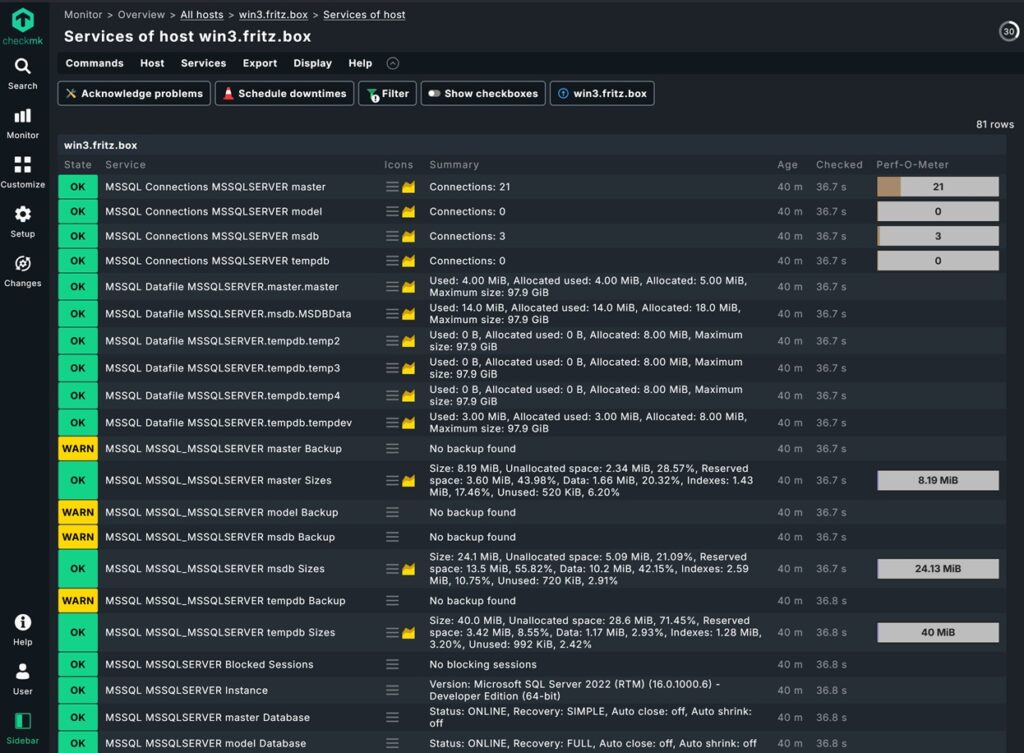
On the monitored host download the Checkmk SQL Server plugin from the Checkmk server to %ProgramData%\checkmk\agent\plugins . Next create the config file with the following content:
Setting up comprehensive monitoring with Checkmk gives you end-to-end visibility across your entire infrastructure. By following these steps, you can:
✅ Monitor hosts with secure TLS connections ✅ Track database performance for PostgreSQL, SQL Server, and DB2 ✅ Get alerts before issues impact your users ✅ Analyze trends with historical data and dashboards